The Long and Short
Choosing between credit or duration risk
This material is a Marketing Communication and does not constitute Independent Investment Research.
The corporate primary market has proved highly inconsistent over the past month and a half, with prospective issuers struggling to navigate day-to-day swings in risk market sentiment. This has limited new supply and forced issuers to postpone or indefinitely delay new bond deals. With less consistent options available through the primary calendar, investors should consider strategies in the secondary market to achieve incremental yield—specifically, weighing the alternatives of adding credit or duration risk.
The dynamics of the corporate bond market have changed considerably over the past several months, the aftermath of historic move in rates and the inverted yield curve, Investment grade corporate bond spreads hit a new local wide on October 12 as the Bloomberg Barclays Investment Grade (IG) Index closed at 165 bp option-adjusted spread (OAS) – the highest level since June 2020 during the height of the pandemic. Higher Treasury rates and wider spreads have pushed up the investment grade corporate yield curve (Exhibit 1).
Exhibit 1. US Treasury and investment grade yield curve
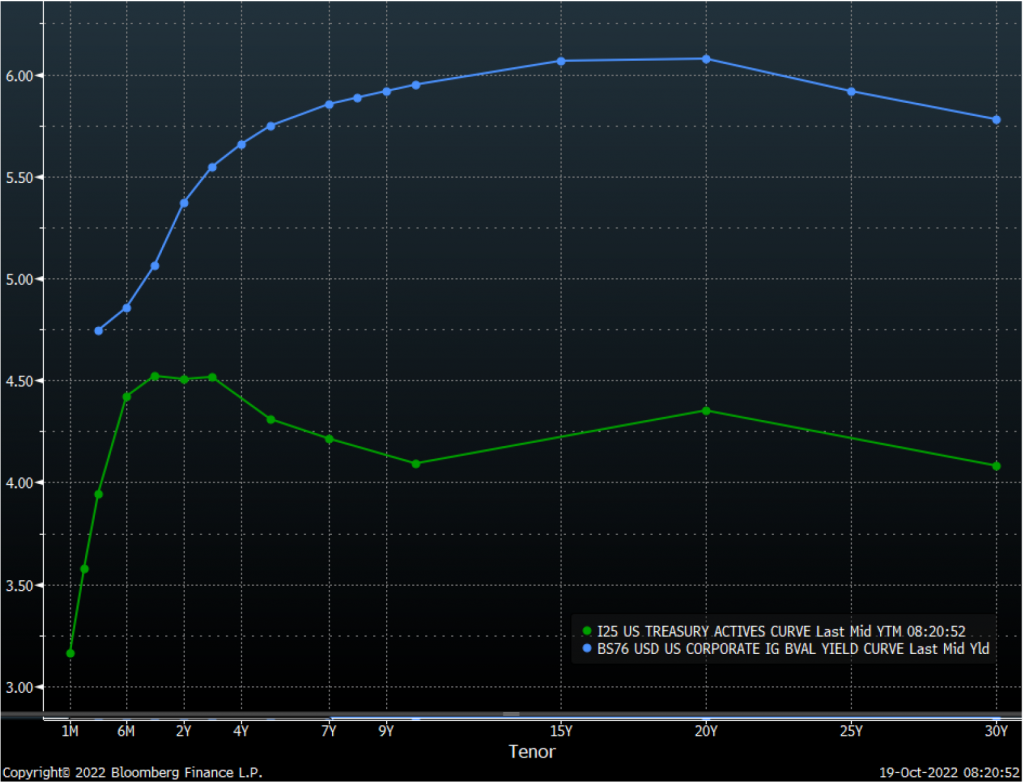
Source: Amherst Pierpont, Bloomberg
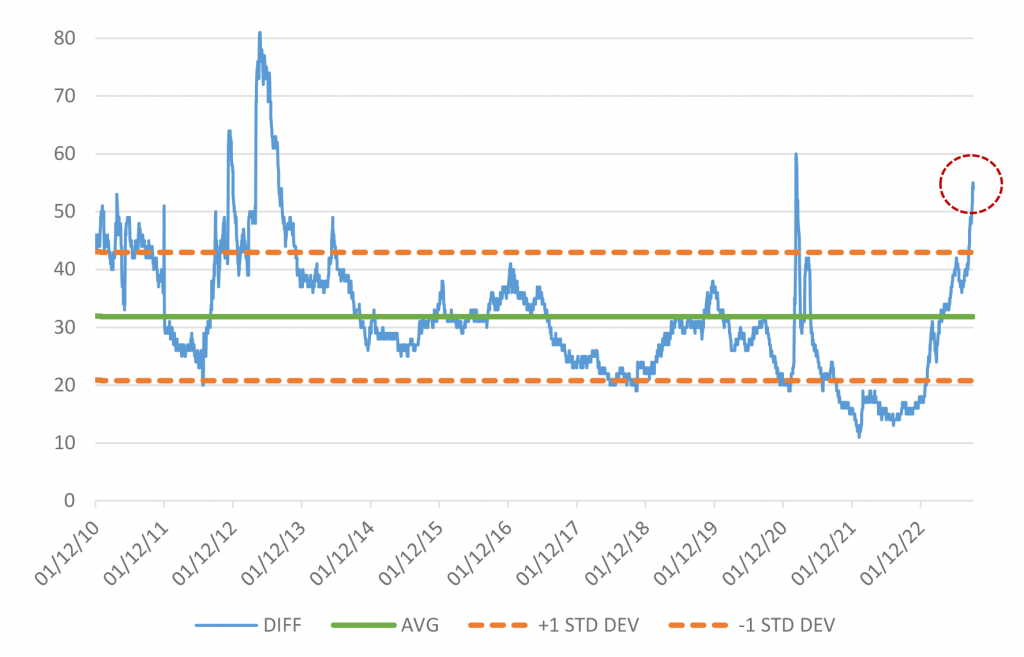
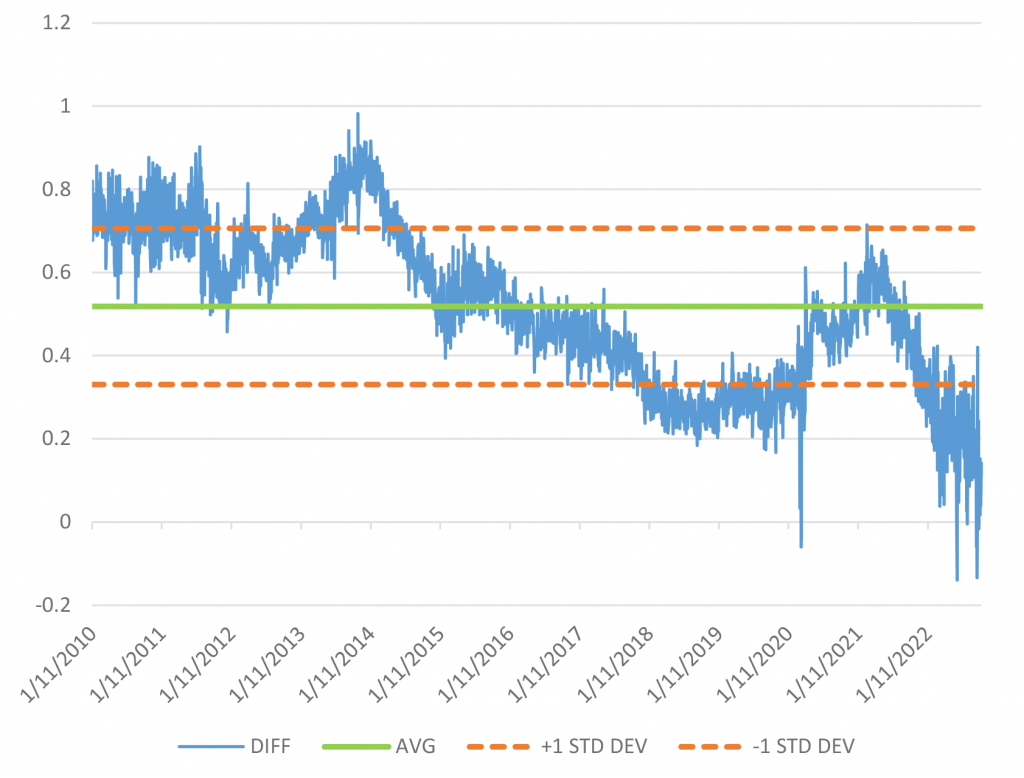
Trading from ‘A’ credit to ‘BBB’ credit looks like fair value for now. Investors currently earn an additional 55 bp of approximate spread to move down in credit to ‘BBB’ from ‘A’ (Exhibit 2). On an historic basis, the average spread pick is 59 bp with a standard deviation of 16 bp. So currently investors are earning just under the average to take on this additional credit risk. This path to incremental spread compares favorably to the extension trades illustrated below, but not as historically attractive as the current compensation to move from ‘AA’ credit to ‘A’ credit.
Exhibit 2. ‘A’ OAS compared to ‘BBB’ OAS
Source: Amherst Pierpont, Bloomberg, corporate indices OAS
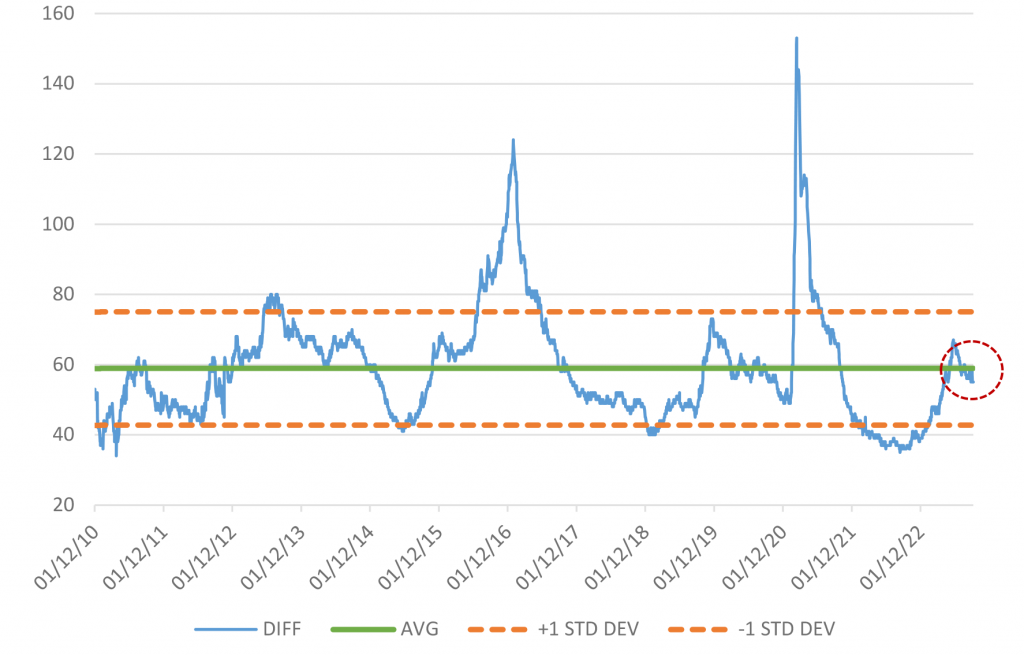
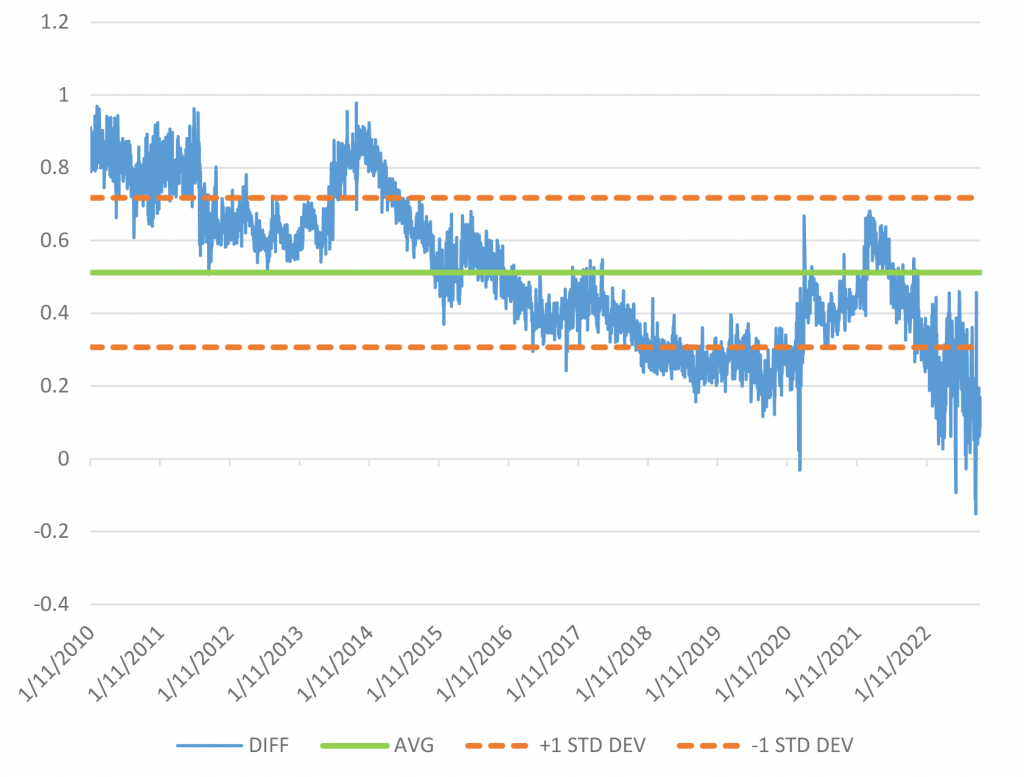
Moving from ‘AA’ to ‘A’ looks like better value. Investors can currently earn an additional 54 bp of spread to move down in credit to ‘A’ from ‘AA’ (Exhibit 3). That level compares with an average spread pick of 32 bp, which is registering well above a full standard deviation of 11 bp. In fact, this is the highest level of additional risk compensation since the height of the global pandemic, and one of the highest levels relative to mean over the entire 12-year time horizon. This appears the most attractive option for investors to achieve incremental yield relative to historical relationships in the studies presented here.
Exhibit 3. ‘AA’ OAS compared to ‘A’ OAS
Source: Amherst Pierpont, Bloomberg, corporate indices OAS
Some examples of actionable AA to A trade suggestions:
- Underweight: CME 2.65% 3/15/32 @ 128/10Y (CME Group: Aa3/AA-/AA-)
- Overweight: CBOE 3% 3/16/32 @ 157/10Y (CBOE Global Markets: A3/A-)
- Pick up: 29 bp
- Underweight: V 2% 8/15/50 @ 90/30Y (Visa: Aa3/AA-)
- Overweight: PYPL 5.05% 6/01/52 @ 192/30Y (PayPal Holdings: A3/A-/A-)
- Pick up: 102 bp (note: significant coupon differential/discount dollar price)
- Underweight: ADP 1.25% 9/01/30 @ 87/10Y (Auto Data Process: Aa3/AA-/AA-)
- Overweight: SPGI 1.25% 08/15/30 @ 131/10Y (S&P Global: A3/A-)
- Pick up: 44 bp
Meredith Contente provides additional ‘AA’-to-‘A’ ideas elsewhere in this issue.
Investors can also extend credit portfolio duration along different parts of the yield curve:
- 3-year to 5-year
- 5-year to 7-year
- 7-year to 10-year
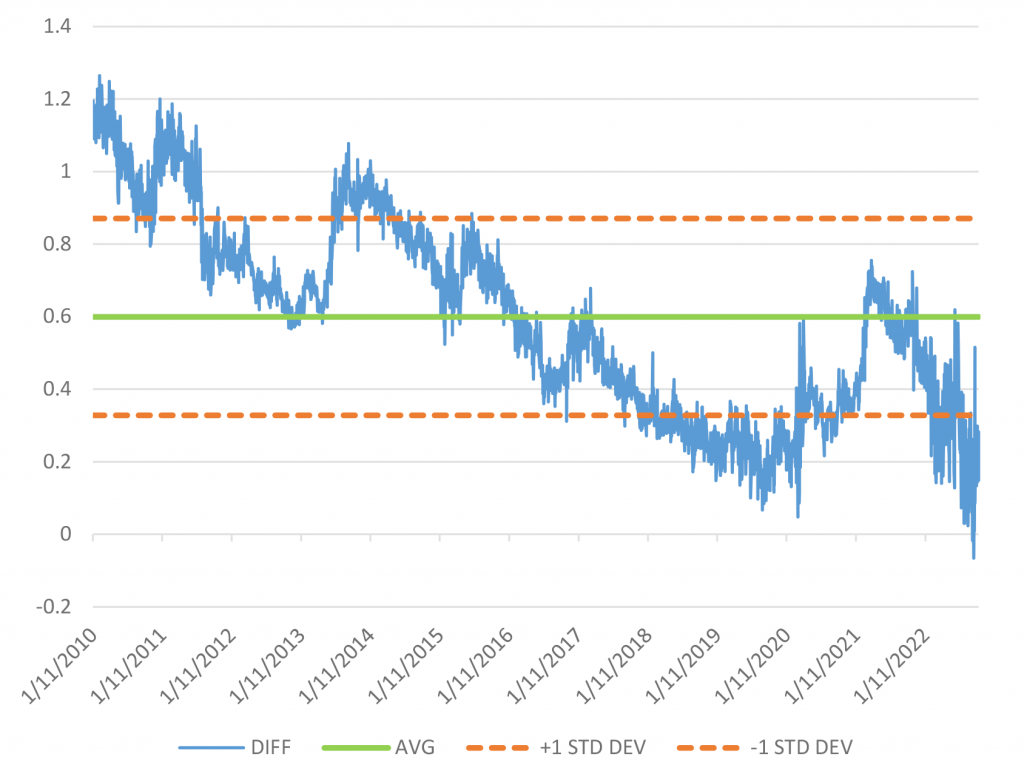
The flat intermediate yield curve for investment grade corporates is highly evident in the historical data and the current yield ladder from 3s to 10s. The first of these options currently presents the opportunity to add just 20 bp of yield for a move from 3-year maturity to 5-year maturity. That compares with a 12-year average of 60 bp, and is well below a full standard deviation of the mean, which is 27 bp. Similarly, an extension trade from 5-year maturity to 7-year maturity offers up just under 11 bp of incremental yield. That compares with a 12-year average of 51 bp and is below two full standard deviations from the mean. An extension trade to 10-year maturities from 7-year is likewise discouraging with a yield differential of under 10 bp versus a 12-year average of 52 bp and a standard deviation of 18 bp. So, among the three options presented here, the 3-to-5-year trade offers up the better yield grab historically versus the other two; but as demonstrated earlier, investors are better suited to seek yield through down-in-credit strategies versus taking on additional duration risk.
Exhibit 4. Incremental yield for moving to 5-year corporate from 3-year corporate
Source: Amherst Pierpont, Bloomberg
Exhibit 5. Incremental yield for moving to a 7-year corporate from a 5-year corporate
Source: Amherst Pierpont, Bloomberg
Exhibit 6. Incremental yield for moving to a 10-year corporate from a 7-year corporate.
Source: Amherst Pierpont, Bloomberg
This material is intended only for institutional investors and does not carry all of the independence and disclosure standards of retail debt research reports. In the preparation of this material, the author may have consulted or otherwise discussed the matters referenced herein with one or more of SCM’s trading desks, any of which may have accumulated or otherwise taken a position, long or short, in any of the financial instruments discussed in or related to this material. Further, SCM may act as a market maker or principal dealer and may have proprietary interests that differ or conflict with the recipient hereof, in connection with any financial instrument discussed in or related to this material.
This message, including any attachments or links contained herein, is subject to important disclaimers, conditions, and disclosures regarding Electronic Communications, which you can find at https://portfolio-strategy.apsec.com/sancap-disclaimers-and-disclosures.
Important Disclaimers
Copyright © 2026 Santander US Capital Markets LLC and its affiliates (“SCM”). All rights reserved. SCM is a member of FINRA and SIPC. This material is intended for limited distribution to institutions only and is not publicly available. Any unauthorized use or disclosure is prohibited.
In making this material available, SCM (i) is not providing any advice to the recipient, including, without limitation, any advice as to investment, legal, accounting, tax and financial matters, (ii) is not acting as an advisor or fiduciary in respect of the recipient, (iii) is not making any predictions or projections and (iv) intends that any recipient to which SCM has provided this material is an “institutional investor” (as defined under applicable law and regulation, including FINRA Rule 4512 and that this material will not be disseminated, in whole or part, to any third party by the recipient.
The author of this material is an economist, desk strategist or trader. In the preparation of this material, the author may have consulted or otherwise discussed the matters referenced herein with one or more of SCM’s trading desks, any of which may have accumulated or otherwise taken a position, long or short, in any of the financial instruments discussed in or related to this material. Further, SCM or any of its affiliates may act as a market maker or principal dealer and may have proprietary interests that differ or conflict with the recipient hereof, in connection with any financial instrument discussed in or related to this material.
This material (i) has been prepared for information purposes only and does not constitute a solicitation or an offer to buy or sell any securities, related investments or other financial instruments, (ii) is neither research, a “research report” as commonly understood under the securities laws and regulations promulgated thereunder nor the product of a research department, (iii) or parts thereof may have been obtained from various sources, the reliability of which has not been verified and cannot be guaranteed by SCM, (iv) should not be reproduced or disclosed to any other person, without SCM’s prior consent and (v) is not intended for distribution in any jurisdiction in which its distribution would be prohibited.
In connection with this material, SCM (i) makes no representation or warranties as to the appropriateness or reliance for use in any transaction or as to the permissibility or legality of any financial instrument in any jurisdiction, (ii) believes the information in this material to be reliable, has not independently verified such information and makes no representation, express or implied, with regard to the accuracy or completeness of such information, (iii) accepts no responsibility or liability as to any reliance placed, or investment decision made, on the basis of such information by the recipient and (iv) does not undertake, and disclaims any duty to undertake, to update or to revise the information contained in this material.
Unless otherwise stated, the views, opinions, forecasts, valuations, or estimates contained in this material are those solely of the author, as of the date of publication of this material, and are subject to change without notice. The recipient of this material should make an independent evaluation of this information and make such other investigations as the recipient considers necessary (including obtaining independent financial advice), before transacting in any financial market or instrument discussed in or related to this material.
Important disclaimers for clients in the EU and UK
This publication has been prepared by Trading Desk Strategists within the Sales and Trading functions of Santander US Capital Markets LLC (“SanCap”), the US registered broker-dealer of Santander Corporate & Investment Banking. This communication is distributed in the EEA by Banco Santander S.A., a credit institution registered in Spain and authorised and regulated by the Bank of Spain and the CNMV. Any EEA recipient of this communication that would like to affect any transaction in any security or issuer discussed herein should do so with Banco Santander S.A. or any of its affiliates (together “Santander”). This communication has been distributed in the UK by Banco Santander, S.A.’s London branch, authorised by the Bank of Spain and subject to regulatory oversight on certain matters by the Financial Conduct Authority (FCA) and the Prudential Regulation Authority (PRA).
The publication is intended for exclusive use for Professional Clients and Eligible Counterparties as defined by MiFID II and is not intended for use by retail customers or for any persons or entities in any jurisdictions or country where such distribution or use would be contrary to local law or regulation.
This material is not a product of Santander´s Research Team and does not constitute independent investment research. This is a marketing communication and may contain ¨investment recommendations¨ as defined by the Market Abuse Regulation 596/2014 ("MAR"). This publication has not been prepared in accordance with legal requirements designed to promote the independence of research and is not subject to any prohibition on dealing ahead of the dissemination of investment research. The author, date and time of the production of this publication are as indicated herein.
This publication does not constitute investment advice and may not be relied upon to form an investment decision, nor should it be construed as any offer to sell or issue or invitation to purchase, acquire or subscribe for any instruments referred herein. The publication has been prepared in good faith and based on information Santander considers reliable as of the date of publication, but Santander does not guarantee or represent, express or implied, that such information is accurate or complete. All estimates, forecasts and opinions are current as at the date of this publication and are subject to change without notice. Unless otherwise indicated, Santander does not intend to update this publication. The views and commentary in this publication may not be objective or independent of the interests of the Trading and Sales functions of Santander, who may be active participants in the markets, investments or strategies referred to herein and/or may receive compensation from investment banking and non-investment banking services from entities mentioned herein. Santander may trade as principal, make a market or hold positions in instruments (or related derivatives) and/or hold financial interest in entities discussed herein. Santander may provide market commentary or trading strategies to other clients or engage in transactions which may differ from views expressed herein. Santander may have acted upon the contents of this publication prior to you having received it.
This publication is intended for the exclusive use of the recipient and must not be reproduced, redistributed or transmitted, in whole or in part, without Santander’s consent. The recipient agrees to keep confidential at all times information contained herein.


