The Big Idea
Broad and fast inflation
This material is a Marketing Communication and does not constitute Independent Investment Research.
The most disturbing aspect of the last two CPI reports was the overwhelming breadth of price increases. Rather than reflecting a narrow base of volatile categories, as was the case in the spring of 2021, the rapid increase in inflation in 2022 has come from a wide array of categories, including those that tend to be quite persistent. This alignment may mean that inflation will be slower to moderate than the Federal Reserve and most economists project.
Trimmed mean and median CPI
The Cleveland Fed parses the CPI data in two interesting ways. Researchers rank the line items by the pace of inflation, using the relative importance for each category to weigh the contributions. This allows them to calculate two different indices: a trimmed-mean index and a distinct median index.
First, the trimmed-mean index lops off the categories that constitute the bottom 8% of the index and the top 8% at any point in time based on the rankings by rate of change. Conceptually, this is similar to core inflation, but instead of arbitrarily assuming that only food and energy products and services are volatile, the trimmed-mean calculation allows the data to dictate which line items are outliers. The presumption is that the middle 84% of the index is a better representation of underlying inflation trends than either the headline or the core index, both of which can be pushed around by sharp temporary moves in volatile categories such as used vehicle prices, for example.
Second, the ranking process can be tracked all the way to the middle. The Cleveland Fed’s median CPI is the one-month, or 12-month, inflation rate of the single component that is in the 50th percentile of price changes.
There are a few striking developments to point out in comparing the Cleveland Fed’s inflation measures to the headline and core CPI. First, while the CPI has decelerated in recent months, mainly reflecting the pullback in gasoline prices, and core CPI is running only slightly above its February and March readings, the trimmed-mean and median CPI measures have continued to accelerate significantly and consistently (Exhibit 1). This speaks to the broadening aspect of the inflation problem.
Exhibit 1: Year-over-year inflation by different measures
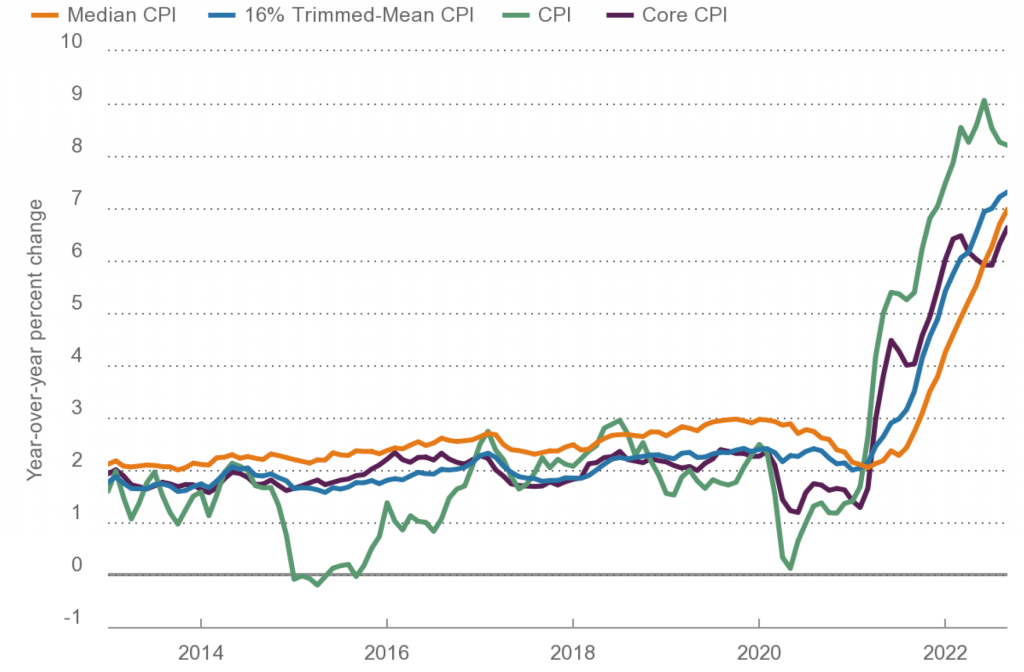
Source: BLS, Cleveland Fed, Haver Analytics
Second, for about a year, from early 2021 to early 2022, the core CPI was running well in excess of the trimmed-mean and median CPI gauges. This reflected the fact that core inflation was being boosted by some of the more volatile categories, such as vehicle prices and airfares. That alignment has now flipped. Even with the noticeable acceleration in the year-over-year core CPI inflation rate in August and September, both the trimmed-mean and median CPI measures are now running well above core CPI. The September reading for year-over-year core CPI rose to 6.6%, a new 40-year high, but the trimmed-mean and median CPI indices were even worse, 7.3% and 7.0%, respectively. What this means is that, as I have pointed out in recent CPI recaps, the noisy categories within the core, such as airfares and used vehicle prices, are actually dragging inflation down at the margin, the opposite of what took place in 2021.
Distribution of Component Price Increases
The Cleveland Fed ranking calculations used to calculate these indices offer confirmation of the sense that high inflation is broad. In September, the trimmed-mean CPI jumped by 0.6% (same as the core CPI) and the median CPI surged by 0.7%. The ranking of the individual components show that 16.5% of the index posted negative readings in September, highlighted by gasoline prices (which have about a 5% weight) and used vehicles (roughly a 4% weight).
The striking element of the September rankings is a hollowing out of the modest inflation range. Last month, less than 10% of the index by weight posted a one-month annualized inflation rate of 0% to 3% (prior to the pandemic, that range would have incorporated most of the overall index). Meanwhile, 45% of the index by weight posted a one-month inflation rate of 5% to 10%, while nearly 20% was up by more than 10%.
The Dallas Fed conducts a similar exercise for the PCE deflator, calculating a trimmed-mean index. The PCE deflator generally tends to run somewhat lower than the CPI, but the distribution of price increases is similarly troubling (Exhibit 2). Similar to the CPI data from the Cleveland Fed, the PCE distribution shows a hollowing out of the 0% to 3% range. In August (the last available data), just over 20% of the weight of the index was negative (including gasoline, used vehicles, and a handful of other sizable categories). However, only 12.5% of the weight of the index posted an annualized increase of 0% to 3%. More troublingly, almost 60% of the index jumped at more than a 5% annualized clip, including nearly 30% that rose faster than a 10% pace.
Exhibit 2: The evolving distribution of PCE component prices
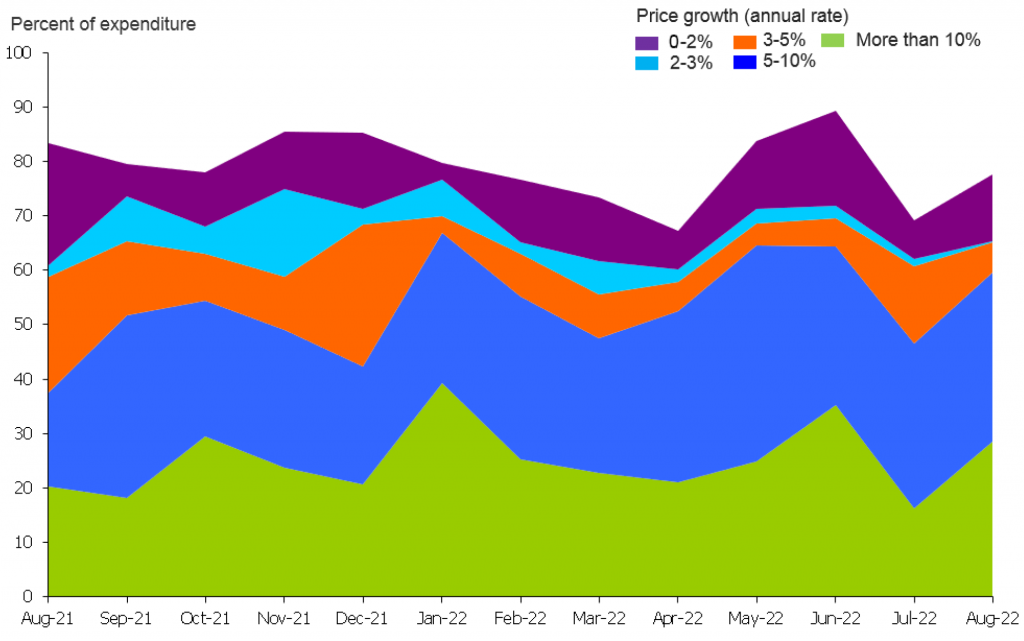
Source: Dallas Fed.
This means that the inflation problem is not idiosyncratic. Getting relief on a single item will do little to resolve the generalized inflation problem. For example, a good argument can be made that, with the housing market cooling sharply, shelter costs are likely to decelerate noticeably, beginning some time in 2023. If shelter costs were the main or only driver of high inflation, it might make sense for the Fed to look forward and have confidence in a decisive moderation in price hikes. However, to the extent that inflation has many drivers these days, the Fed will need to attack the root of the problem (an overheated economy and, in particular, an overheated labor market) rather than cross their fingers and hope for relief in a few individual categories.
This material is intended only for institutional investors and does not carry all of the independence and disclosure standards of retail debt research reports. In the preparation of this material, the author may have consulted or otherwise discussed the matters referenced herein with one or more of SCM’s trading desks, any of which may have accumulated or otherwise taken a position, long or short, in any of the financial instruments discussed in or related to this material. Further, SCM may act as a market maker or principal dealer and may have proprietary interests that differ or conflict with the recipient hereof, in connection with any financial instrument discussed in or related to this material.
This message, including any attachments or links contained herein, is subject to important disclaimers, conditions, and disclosures regarding Electronic Communications, which you can find at https://portfolio-strategy.apsec.com/sancap-disclaimers-and-disclosures.
Important Disclaimers
Copyright © 2026 Santander US Capital Markets LLC and its affiliates (“SCM”). All rights reserved. SCM is a member of FINRA and SIPC. This material is intended for limited distribution to institutions only and is not publicly available. Any unauthorized use or disclosure is prohibited.
In making this material available, SCM (i) is not providing any advice to the recipient, including, without limitation, any advice as to investment, legal, accounting, tax and financial matters, (ii) is not acting as an advisor or fiduciary in respect of the recipient, (iii) is not making any predictions or projections and (iv) intends that any recipient to which SCM has provided this material is an “institutional investor” (as defined under applicable law and regulation, including FINRA Rule 4512 and that this material will not be disseminated, in whole or part, to any third party by the recipient.
The author of this material is an economist, desk strategist or trader. In the preparation of this material, the author may have consulted or otherwise discussed the matters referenced herein with one or more of SCM’s trading desks, any of which may have accumulated or otherwise taken a position, long or short, in any of the financial instruments discussed in or related to this material. Further, SCM or any of its affiliates may act as a market maker or principal dealer and may have proprietary interests that differ or conflict with the recipient hereof, in connection with any financial instrument discussed in or related to this material.
This material (i) has been prepared for information purposes only and does not constitute a solicitation or an offer to buy or sell any securities, related investments or other financial instruments, (ii) is neither research, a “research report” as commonly understood under the securities laws and regulations promulgated thereunder nor the product of a research department, (iii) or parts thereof may have been obtained from various sources, the reliability of which has not been verified and cannot be guaranteed by SCM, (iv) should not be reproduced or disclosed to any other person, without SCM’s prior consent and (v) is not intended for distribution in any jurisdiction in which its distribution would be prohibited.
In connection with this material, SCM (i) makes no representation or warranties as to the appropriateness or reliance for use in any transaction or as to the permissibility or legality of any financial instrument in any jurisdiction, (ii) believes the information in this material to be reliable, has not independently verified such information and makes no representation, express or implied, with regard to the accuracy or completeness of such information, (iii) accepts no responsibility or liability as to any reliance placed, or investment decision made, on the basis of such information by the recipient and (iv) does not undertake, and disclaims any duty to undertake, to update or to revise the information contained in this material.
Unless otherwise stated, the views, opinions, forecasts, valuations, or estimates contained in this material are those solely of the author, as of the date of publication of this material, and are subject to change without notice. The recipient of this material should make an independent evaluation of this information and make such other investigations as the recipient considers necessary (including obtaining independent financial advice), before transacting in any financial market or instrument discussed in or related to this material.
Important disclaimers for clients in the EU and UK
This publication has been prepared by Trading Desk Strategists within the Sales and Trading functions of Santander US Capital Markets LLC (“SanCap”), the US registered broker-dealer of Santander Corporate & Investment Banking. This communication is distributed in the EEA by Banco Santander S.A., a credit institution registered in Spain and authorised and regulated by the Bank of Spain and the CNMV. Any EEA recipient of this communication that would like to affect any transaction in any security or issuer discussed herein should do so with Banco Santander S.A. or any of its affiliates (together “Santander”). This communication has been distributed in the UK by Banco Santander, S.A.’s London branch, authorised by the Bank of Spain and subject to regulatory oversight on certain matters by the Financial Conduct Authority (FCA) and the Prudential Regulation Authority (PRA).
The publication is intended for exclusive use for Professional Clients and Eligible Counterparties as defined by MiFID II and is not intended for use by retail customers or for any persons or entities in any jurisdictions or country where such distribution or use would be contrary to local law or regulation.
This material is not a product of Santander´s Research Team and does not constitute independent investment research. This is a marketing communication and may contain ¨investment recommendations¨ as defined by the Market Abuse Regulation 596/2014 ("MAR"). This publication has not been prepared in accordance with legal requirements designed to promote the independence of research and is not subject to any prohibition on dealing ahead of the dissemination of investment research. The author, date and time of the production of this publication are as indicated herein.
This publication does not constitute investment advice and may not be relied upon to form an investment decision, nor should it be construed as any offer to sell or issue or invitation to purchase, acquire or subscribe for any instruments referred herein. The publication has been prepared in good faith and based on information Santander considers reliable as of the date of publication, but Santander does not guarantee or represent, express or implied, that such information is accurate or complete. All estimates, forecasts and opinions are current as at the date of this publication and are subject to change without notice. Unless otherwise indicated, Santander does not intend to update this publication. The views and commentary in this publication may not be objective or independent of the interests of the Trading and Sales functions of Santander, who may be active participants in the markets, investments or strategies referred to herein and/or may receive compensation from investment banking and non-investment banking services from entities mentioned herein. Santander may trade as principal, make a market or hold positions in instruments (or related derivatives) and/or hold financial interest in entities discussed herein. Santander may provide market commentary or trading strategies to other clients or engage in transactions which may differ from views expressed herein. Santander may have acted upon the contents of this publication prior to you having received it.
This publication is intended for the exclusive use of the recipient and must not be reproduced, redistributed or transmitted, in whole or in part, without Santander’s consent. The recipient agrees to keep confidential at all times information contained herein.


