


The Big Idea
Brief safe harbors from volatility
Steven Abrahams | October 14, 2022
This document is intended for institutional investors and is not subject to all of the independence and disclosure standards applicable to debt research reports prepared for retail investors. This material does not constitute research.
Market uncertainty now signals a level of stress only seen a few times in the last few decades. And it might seem that a drumbeat of Fed and payroll and inflation news this year has only turned up the heat. But just the opposite. News on the Fed and the economy has done more to reduce than to inflame volatility, especially this year. By default, it is all the stuff beyond policymakers’ mandate that is driving a difficult market.
Today’s market now stands beside other moments that reflected major possible shifts in the economy, policy or financial markets. Options on Treasury debt imply uncertainty closer to levels seen during the initial days of pandemic in 2020 and during taper tantrum in 2013, which was triggered by concerns over a sudden pivot in Fed QE policy. Current implied volatility comes close to levels seen during the Global Financial Crisis, the record mortgage refinancing waves of the early 2000s and the Russia default of 1998 (Exhibit 1).
Exhibit 1: The MOVE index today echo’s uncertainty similar to past market crises
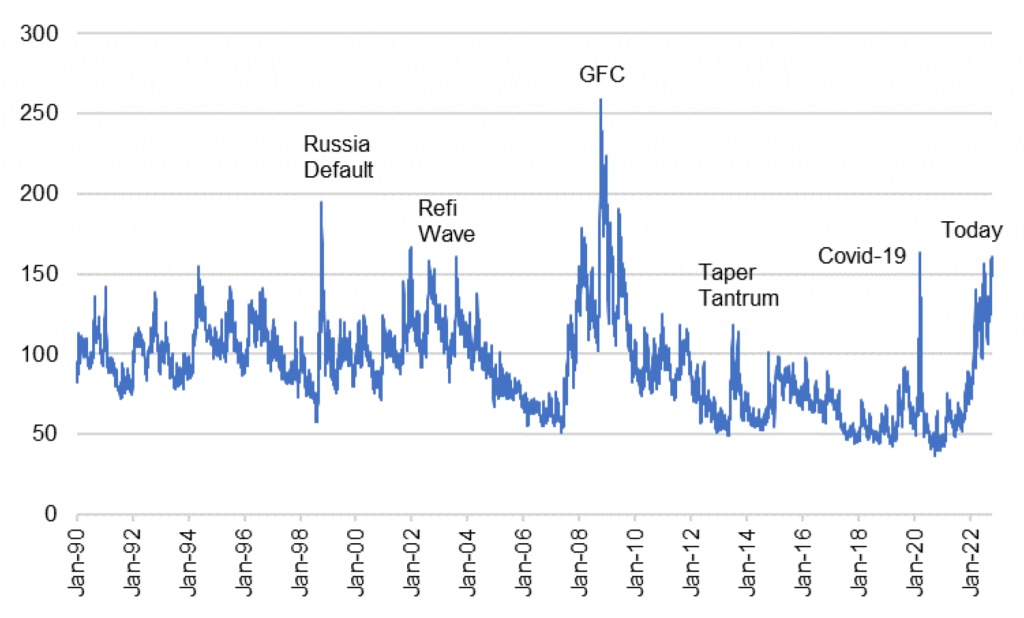
Note: The MOVE index is the weighted average implied volatility in 1-month options on US 2-, 5-,10- and 30-year Treasury debt. Weights are 0.2, 0.2, 0.4 and 0.2, respectively.
Source: Bloomberg, Amherst Pierpont Securities.
One distinct aspect of the current market is that it is arguably the product of an intentional process instead of an unexpected event. The Fed is tightening by design. Pandemic, the Global Financial Crisis and the Russia default came unexpectedly. The taper tantrum and the 2000s refi waves probably fall somewhere in between.
With the Fed clearly driving this episode, it might seem that FOMC meetings and announcements about unemployment and CPI—measures of the Fed’s dual mandate—might stoke the uncertainty. If that’s the case, then regular FOMC announcements and the monthly release of payrolls and CPI should drive implied volatility up, especially on the day the news hits the market and gets built into pricing. But the opposite is generally the case. This year, for example, implied volatility has typically dropped from the close of markets before the news hit to the close after the news hit. That is true for FOMC announcements and the release of payrolls and CPI (Exhibit 2).
Exhibit 2: FOMC announcements, payrolls and CPI have reduced vol in 2022
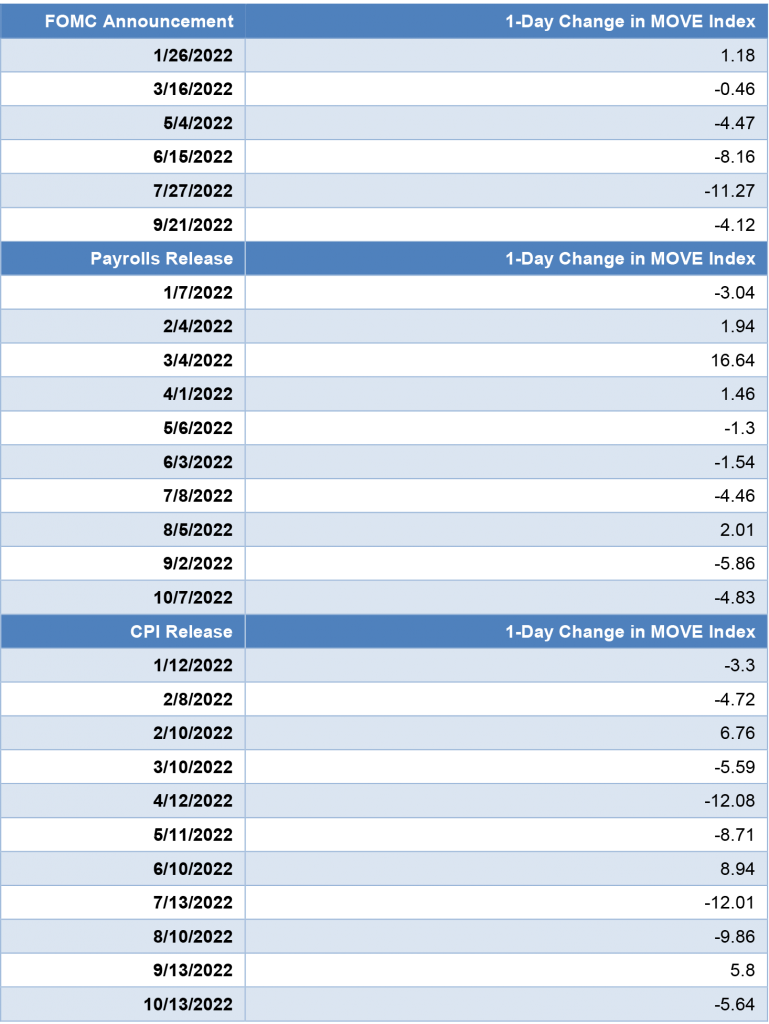
Source: Bloomberg, Federal Reserve, Amherst Pierpont Securities.
It turns out that 2022 is no exception. Using the last five years of the MOVE index, a measure of implied volatility in 1-month options on Treasury debt, FOMC announcements along with the release of payrolls and CPI always tend to drive uncertainty down (Exhibit 3). This year, in fact, FOMC and CPI news has had more than twice the impact of prior years while payrolls news has just had its average effect. If anything, the importance of the news on Fed policy and CPI is more important than ever.
Exhibit 3: FOMC and CPI have a bigger impact on vol this year
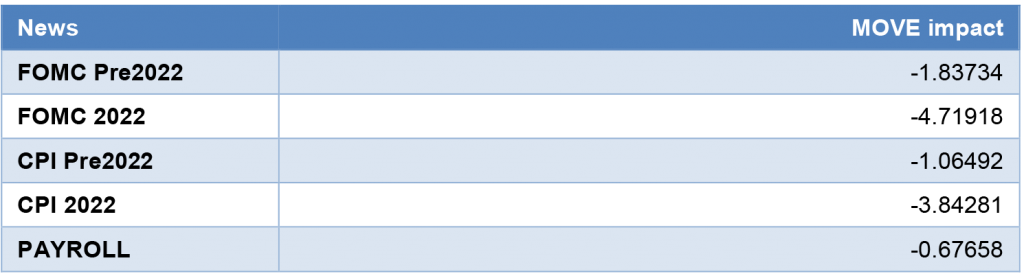
Note: based on a regression of 1-day changes in MOVE on (i) an indicator of FOMC announcement date, (ii) an indicator of CPI release date, (iii) an indicator of payrolls release date, (iv) an indicator of 2022 dates and (v) an interaction between the 2022 indicator and the indicators for FOMC and CPI. All variables significant at the 0.10 level or lower.
Source: Bloomberg, Federal Reserve, Amherst Pierpont Securities.
By default, all the things happening on days without FOMC or CPI or payrolls news are the things driving current volatility. For investors, the days with FOMC, CPI or payrolls news seem to be reliable if brief safe harbors.
* * *
The view in rates
OIS forward rates now imply fed funds will peak around 4.60% by mid-2023 and hold there into mid-2024. The market is finally pricing a Fed that will hike and hold. Persistent shelter and medical care inflation along with tight labor should keep the Fed at a plateau in rates for at least that long. Market pricing is the closest to a realistic view of the Fed since tightening began.
Fed RRP balances closed Friday at $2.22 trillion, roughly the average since June. Yields on Treasury bills into late November continue to trade below the current 3.05% rate on RRP cash. Money market funds have little alternative but to put proceeds into RRP
.
Settings on 3-month LIBOR have closed Friday at 419 bp, higher by 45 bp on the week. Setting on 3-month term SOFR closed Friday at 392 bp, higher by 33 bp.
Further out the curve, the 2-year note closed Friday at 4.50%, toward the high end of fair value based on Fed dots through 2024. The 10-year note closed well above fundamental fair value at 4.02%, so the higher yield has to get chalked up to more sellers than buyers. Those sellers so far include the Fed, of course, banks, mutual funds and mortgage REITs and other delta hedgers. And it likely includes foreign investors, although the data there is lagging
The Treasury yield curve has finished its most recent session with 2s10s at -47 bp, flatter by 2 bp on the week. The 5s30s finished the most recent session at -27 bp, steeper by 4 bp on the week. The 2s10s curve looks likely to invert by around 70 bp shortly before Fed tightening comes to an end.
Breakeven 10-year inflation finished the week at 241 bp, up 26 bp from a week before. The 10-year real rate finished the week at 161 bp, down 7 bp.
The view in spreads
Volatility should continue while the Fed’s path stays in flux. Both MBS and credit have widened steadily since mid-August. Nominal par 30-year MBS spreads to the blend of 5- and 10-year Treasury yields finished the most recent session at 177 bp, wider by 5 bp on the week. Par 30-year MBS OAS finished the week at 69 bp, wider by 7 bp on the week. Investment grade cash credit spreads have finished the week at 194 bp over the SOFR curve, wider by 7 bp.
The view in credit
Credit fundamentals have started to soften with the weakest credits showing slower revenue growth so far in 2022, declining free operating cash flow and less cash on the balance sheet. Ahead lays weaker demand, margin pressure, a soft housing market and various risks from Covid and supply interruptions. Inflation will land differently across different balance sheets. A recent New York Fed study argues inflation generally helps companies lift gross margins, although airlines and leisure may have an easier time passing through costs than healthcare, retail and restaurants. In leveraged loans, a higher real cost of funds would start to eat away at highly leveraged balance sheets with weak or volatile revenues.
Delinquencies have started to climb in FHA mortgages, a signal of initial stress among weaker borrowers. Consumer balance sheets look strong otherwise with rising income, substantial savings and big gains in real estate and investment portfolios. Homeowner equity jumped by $3.5 trillion in 2021, and mortgage delinquencies have dropped to a record low. But inflation and recession could take a toll and add credit risk to consumer balance sheets.