The Big Idea
Medical care poses an inflation challenge for the Fed
This material is a Marketing Communication and does not constitute Independent Investment Research.
The two largest components of core inflation by far are shelter costs and medical care. And both categories have been accelerating this year. Recent work by the Dallas Fed, paralleling work done there on shelter costs, indicates that upward pressure on wages in health care will drive inflation in this industry higher for the foreseeable future. With momentum in shelter costs also pushing up inflation, the Fed will need to work harder on other components of core to hit their inflation targets.
Key pieces of core inflation
Shelter costs and medical care together account for 51% of core CPI, shelter costs accounting for about 40% with medical care for almost 11%. The two account for nearly 35% of the core PCE deflator, with the weights more balanced. Shelter costs accounts for 16.9% and health care for 17.8%.
The main reason for the massive difference in weighting, especially for medical care, is that the CPI measures only out-of-pocket expenses, while the PCE deflator accounts for all medical care expenditures made on behalf of households, including those by insurance companies and federal government programs.
Health care inflation
The Dallas Fed has recently turned its attention to the dynamics of health care inflation, coming in the wake of earlier work there on shelter cost inflation, a topic I explored in a recent piece, Researchers at the Dallas Fed have taken a close look at the link between the wages of health care workers and medical care inflation. Their work found a strong correlation between the wage gains of hospital workers and PCE health care inflation, with a lag of about a year.
As an aside, in discussions of hospital workers, highly skilled and well-paid doctors may come to mind first. But hospitals employ a wide array of workers that covers nearly all points along the wage scale, including professionals such as doctors and nurses as well as a myriad of support staff. In short, hospitals are a labor-intensive sector of the economy, incorporating workers across the span of the wage scale. So, it stands to reason that prices in the sector would track wages with a lag.
In any case, the tight link between wages and prices in health care represents bad news for the inflation outlook. The Dallas Fed work shows the strong correlation historically, as well as the recent run-up in wages, as measured by the Employment Cost Index (Exhibit 1).
Exhibit 1: A clear link between wage growth and inflation in health care
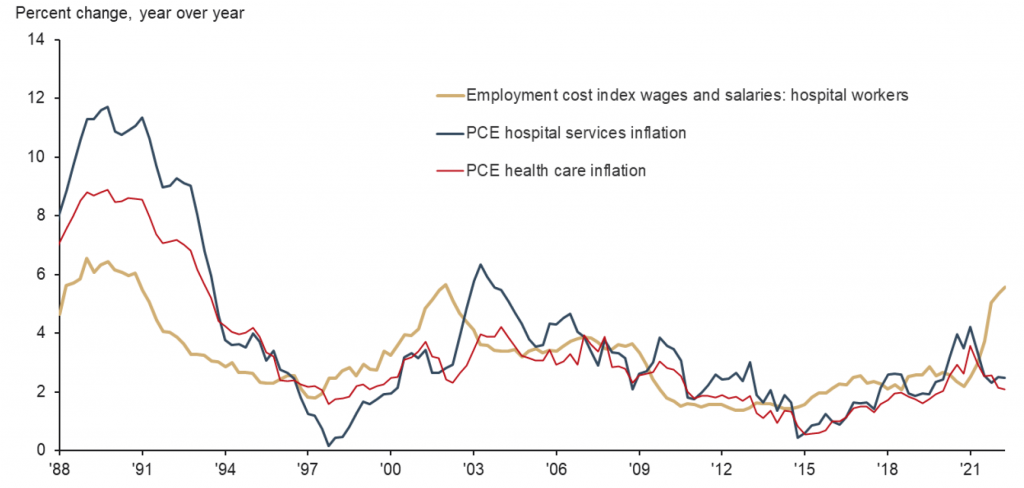
Note: PCE is personal consumption expenditures.
Sources: Bureau of Economic Analysis, Bureau of Labor Statistics, Haver Analytics.
Dallas Fed researchers developed a regression model to predict the health care component of the PCE deflator. Through June this year, health care inflation was quite benign in the PCE deflator, running just above 2% on a year-over-year basis. However, the Dallas Fed model suggests health care inflation is likely to surge to roughly 4% by mid-2023. Perhaps even more troubling, the model points to scant deceleration in 2024, with the largest component of the core CPE deflator still running at a 3.5% year-over-year clip by the end of 2024 (Exhibit 2).
Exhibit 2: Dallas Fed projected PCE health care inflation rises
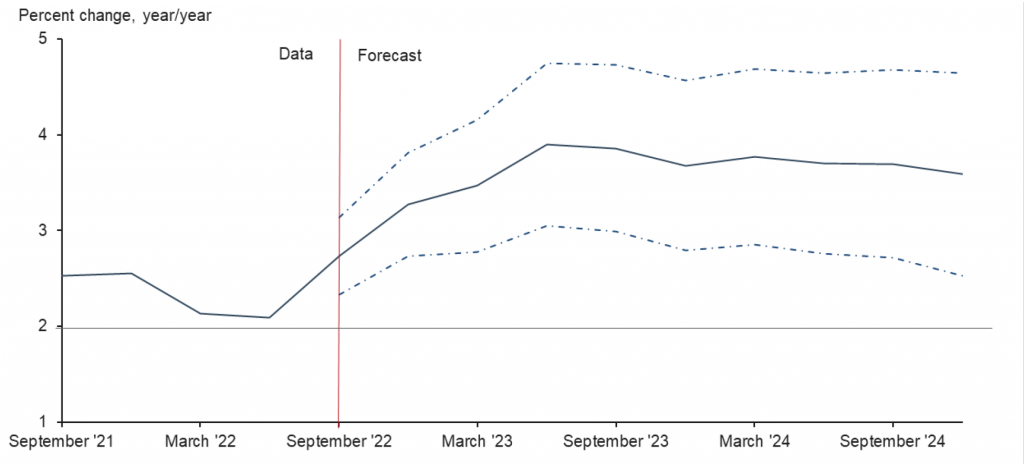
Notes: Forecasts are based on authors’ estimation of a quarterly vector autoregressive model with eight lags and and intercept including the three variables: year-over-year percent change in employment cost index wages and salaries for hospital workers, personal consumption expenditures (PCE) hospital services inflation and PCE health care inflation. Dashed lines indicate a 90 percent prediction interval.
Sources: Bureau of Economic Analysis, Bureau of Labor Statistics, Haver Analytics.
Given the weight of health care in the PCE deflator, a 3.9% annual inflation rate for the category would contribute about 0.7 percentage points to core inflation, a little over three tenths more than the contribution in the second quarter this year.
Stubborn core inflation
Previous work from the Dallas Fed showed, similarly, that shelter costs are likely to accelerate until around the middle of 2023. If the two largest components of core inflation are both accelerating for the better part of a year, it is difficult to see how core inflation will cool as much and as fast as consensus forecasts project.
In particular, the FOMC median projection for the year-over-year advance of the core PCE deflator issued last week showed a moderation from the current pace of nearly 5% to around 3% by the end of next year. If the largest component roughly doubles between now and then, and shelter costs are equal to or higher than they are now, as the Dallas Fed researchers projected earlier this summer, then the balance of the index would have to slow sharply to achieve anything close to the moderation envisioned by the Fed.
This material is intended only for institutional investors and does not carry all of the independence and disclosure standards of retail debt research reports. In the preparation of this material, the author may have consulted or otherwise discussed the matters referenced herein with one or more of SCM’s trading desks, any of which may have accumulated or otherwise taken a position, long or short, in any of the financial instruments discussed in or related to this material. Further, SCM may act as a market maker or principal dealer and may have proprietary interests that differ or conflict with the recipient hereof, in connection with any financial instrument discussed in or related to this material.
This message, including any attachments or links contained herein, is subject to important disclaimers, conditions, and disclosures regarding Electronic Communications, which you can find at https://portfolio-strategy.apsec.com/sancap-disclaimers-and-disclosures.
Important Disclaimers
Copyright © 2026 Santander US Capital Markets LLC and its affiliates (“SCM”). All rights reserved. SCM is a member of FINRA and SIPC. This material is intended for limited distribution to institutions only and is not publicly available. Any unauthorized use or disclosure is prohibited.
In making this material available, SCM (i) is not providing any advice to the recipient, including, without limitation, any advice as to investment, legal, accounting, tax and financial matters, (ii) is not acting as an advisor or fiduciary in respect of the recipient, (iii) is not making any predictions or projections and (iv) intends that any recipient to which SCM has provided this material is an “institutional investor” (as defined under applicable law and regulation, including FINRA Rule 4512 and that this material will not be disseminated, in whole or part, to any third party by the recipient.
The author of this material is an economist, desk strategist or trader. In the preparation of this material, the author may have consulted or otherwise discussed the matters referenced herein with one or more of SCM’s trading desks, any of which may have accumulated or otherwise taken a position, long or short, in any of the financial instruments discussed in or related to this material. Further, SCM or any of its affiliates may act as a market maker or principal dealer and may have proprietary interests that differ or conflict with the recipient hereof, in connection with any financial instrument discussed in or related to this material.
This material (i) has been prepared for information purposes only and does not constitute a solicitation or an offer to buy or sell any securities, related investments or other financial instruments, (ii) is neither research, a “research report” as commonly understood under the securities laws and regulations promulgated thereunder nor the product of a research department, (iii) or parts thereof may have been obtained from various sources, the reliability of which has not been verified and cannot be guaranteed by SCM, (iv) should not be reproduced or disclosed to any other person, without SCM’s prior consent and (v) is not intended for distribution in any jurisdiction in which its distribution would be prohibited.
In connection with this material, SCM (i) makes no representation or warranties as to the appropriateness or reliance for use in any transaction or as to the permissibility or legality of any financial instrument in any jurisdiction, (ii) believes the information in this material to be reliable, has not independently verified such information and makes no representation, express or implied, with regard to the accuracy or completeness of such information, (iii) accepts no responsibility or liability as to any reliance placed, or investment decision made, on the basis of such information by the recipient and (iv) does not undertake, and disclaims any duty to undertake, to update or to revise the information contained in this material.
Unless otherwise stated, the views, opinions, forecasts, valuations, or estimates contained in this material are those solely of the author, as of the date of publication of this material, and are subject to change without notice. The recipient of this material should make an independent evaluation of this information and make such other investigations as the recipient considers necessary (including obtaining independent financial advice), before transacting in any financial market or instrument discussed in or related to this material.
Important disclaimers for clients in the EU and UK
This publication has been prepared by Trading Desk Strategists within the Sales and Trading functions of Santander US Capital Markets LLC (“SanCap”), the US registered broker-dealer of Santander Corporate & Investment Banking. This communication is distributed in the EEA by Banco Santander S.A., a credit institution registered in Spain and authorised and regulated by the Bank of Spain and the CNMV. Any EEA recipient of this communication that would like to affect any transaction in any security or issuer discussed herein should do so with Banco Santander S.A. or any of its affiliates (together “Santander”). This communication has been distributed in the UK by Banco Santander, S.A.’s London branch, authorised by the Bank of Spain and subject to regulatory oversight on certain matters by the Financial Conduct Authority (FCA) and the Prudential Regulation Authority (PRA).
The publication is intended for exclusive use for Professional Clients and Eligible Counterparties as defined by MiFID II and is not intended for use by retail customers or for any persons or entities in any jurisdictions or country where such distribution or use would be contrary to local law or regulation.
This material is not a product of Santander´s Research Team and does not constitute independent investment research. This is a marketing communication and may contain ¨investment recommendations¨ as defined by the Market Abuse Regulation 596/2014 ("MAR"). This publication has not been prepared in accordance with legal requirements designed to promote the independence of research and is not subject to any prohibition on dealing ahead of the dissemination of investment research. The author, date and time of the production of this publication are as indicated herein.
This publication does not constitute investment advice and may not be relied upon to form an investment decision, nor should it be construed as any offer to sell or issue or invitation to purchase, acquire or subscribe for any instruments referred herein. The publication has been prepared in good faith and based on information Santander considers reliable as of the date of publication, but Santander does not guarantee or represent, express or implied, that such information is accurate or complete. All estimates, forecasts and opinions are current as at the date of this publication and are subject to change without notice. Unless otherwise indicated, Santander does not intend to update this publication. The views and commentary in this publication may not be objective or independent of the interests of the Trading and Sales functions of Santander, who may be active participants in the markets, investments or strategies referred to herein and/or may receive compensation from investment banking and non-investment banking services from entities mentioned herein. Santander may trade as principal, make a market or hold positions in instruments (or related derivatives) and/or hold financial interest in entities discussed herein. Santander may provide market commentary or trading strategies to other clients or engage in transactions which may differ from views expressed herein. Santander may have acted upon the contents of this publication prior to you having received it.
This publication is intended for the exclusive use of the recipient and must not be reproduced, redistributed or transmitted, in whole or in part, without Santander’s consent. The recipient agrees to keep confidential at all times information contained herein.


