


By the Numbers
Market pricing for CLO manager risk and liquidity
Caroline Chen | September 30, 2022
This material is a Marketing Communication and does not constitute Independent Investment Research.
Despite wide swings in spreads this year, CLO investors have done a steady job of pricing in differences across managers. The market has clearly priced for differences in the characteristic risk of managers’ loan portfolios and for the frequency of manager issuance, a stand-in for CLO liquidity. The riskier the characteristic manager portfolio and the lower the issuance, the wider the spread. But paying up for managers that issue frequently seems questionable.
A month-by-month look at ‘AAA’ pricing
The CLO market in February offered a good example of market pricing for the risk and expected liquidity of a manager. That month, 24 managers tapped the market for 26 new and relatively standard broadly syndicated loan CLOs:
- Each with a 2-year non-call period.
- Each with a 5-year reinvestment period.
- Each with comparable MVOC for the issued classes.
Since these deals roughly match on structure and MVOC, portfolio risk and liquidity remain as possible big influences on spreads. Managers’ historical portfolio risk appetite, as calculated by the beta in the APS CLO model, varies from 0.89 for Elmwood to 1.08 for Steele Creek with a median of 1.01. Investors priced new issue ‘AAA’ from 130 bp to 142 bp over SOFR with a median of 133 bp. A simple plot of the ‘AAA’ spreads against managers’ beta shows the spreads overall went wider with the rise of managers’ beta (Exhibit 1).
Exhibit 1: A positive relationship between managers’ risk profile and ‘AAA’ pricing
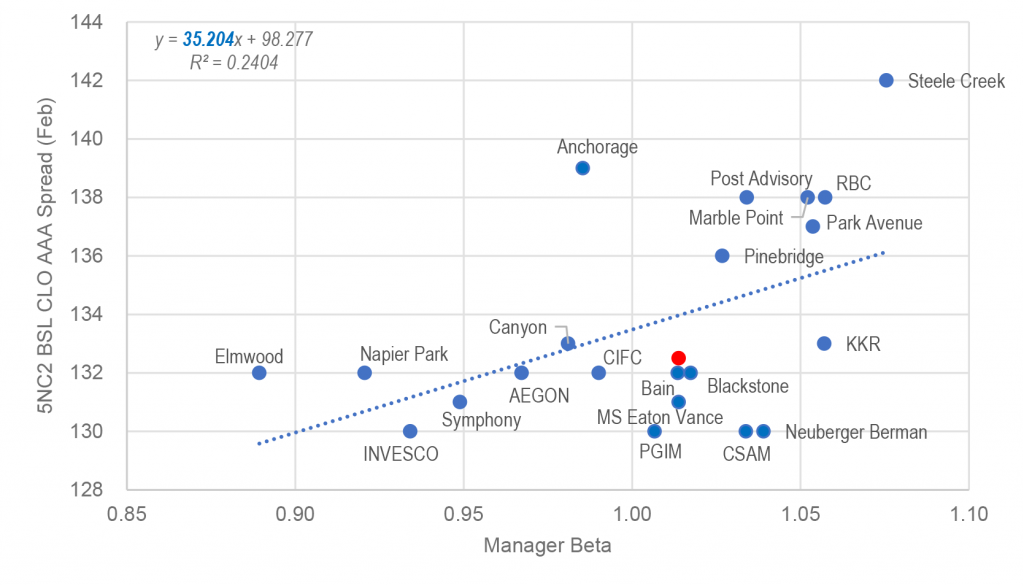
Note: Due to managers’ short performance history, the APS model does not calculate the beta for Diameter capital, Franklin Advisors, and Gulf Stream Asset Management. Their deals are excluded from the analysis. PGIM and Symphony, each issued two BSL CLOs in February, and their average ‘AAA’ spreads were used in the analysis. The red dot represents the median value in February.
Source: Bloomberg, Amherst Pierpont Securities
The steepness of the trend line linking beta to spread has a useful interpretation. In February, a one-unit rise in managers’ beta cost 35 bp of widening in the ‘AAA’ new issue spread. If a manager’s beta were to rise from 1.0 to 1.1, for example, investors tended to price the ‘AAA’ class 3.5 bp wider.
February was not an exception, but the rule. Investors overall have been pretty good at pricing managers’ historical portfolio risk profiles this year. In the first nine months, each month showed a positive slope between beta and ‘AAA’ spread, with a unit rise in managers’ beta moving ‘AAA’ pricing anywhere from 8 bp to 285 bp (Exhibit 2). Of course, the number of deals done in some months is quote low, making the steepness of the trend lines unreliable. But the pattern of a positive trend is clear.
Exhibit 2: Investors overall priced the historical risk appetite of the managers well
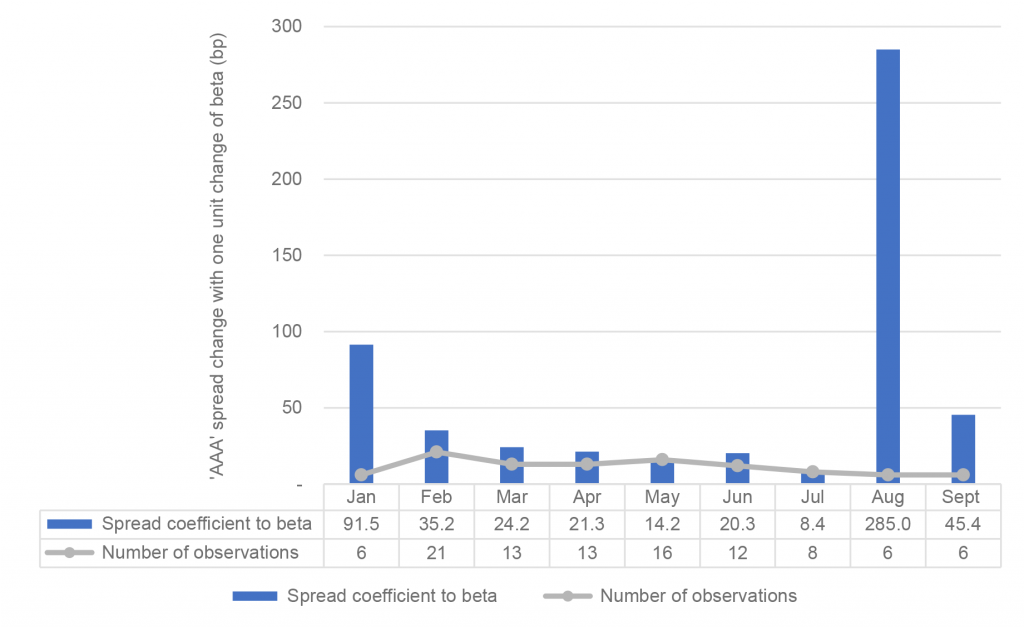
Note: Regressions have managers’ beta as independent variables (X) and new issue ‘AAA’ spreads as dependent variables (Y). The coefficients to beta indicate the steepness of the trend line. To eliminate the structure influence on debt spread, the exhibit only includes managers issued 5NC2 BSL CLOs. Deals from AGL Credit, Diameter Capital, Franklin Advisors, Gulf Stream, and GSAM are excluded from analysis due to no beta value. September new issuance as of September 16, 2022.
Source: Bloomberg, Amherst Pierpont
Spread should widen with beta
CLO debt spreads should widen with portfolio beta. The beta in the APS CLO model measures managers’ loan portfolio risk as a multiple of the Morningstar / LSTA leveraged loan index risk. For example, a beta of 1.1 implies the manager’s portfolio has taken 110% of the broad market risk and that manager’s investment performance return will rise and fall more than the market average. A portfolio with wider swings in returns is also one where the market value of loans could drop below the par balance of debt, pushing MVOC on lower classes below 100. That raises default risk in the long run. Debt backed by a riskier portfolio should have wider spreads than debt backed by a safer portfolio. Hence, a positive relationship exists between managers’ beta and their debt spreads.
Tighter spreads for frequent issuers
February also offers a clear example of pricing for anticipated manager liquidity, and that is clear by looking at managers above (wide) and below (tight) the trend line between beta and spread. Many of the managers below the line are among the most frequent issuers in the market, and managers above the line are much more likely to be infrequent issuers. Frequent issuers may get better execution regardless of the beta. For example, Neuberger Berman, a manager who has issued five CLOs year-to-date, had its ‘AAA’ priced in February at 130 bp over SOFR, 2 bp tighter than the median of ‘AAA’ debt in that month despite a beta of 1.04.
A month-by-month look at ‘BBB’ pricing
Lower-rated CLO debt in February showed the same positive relationship between managers’ beta and spreads but with much more sensitivity than the ‘AAA’ pricing. ‘BBB’ tranches priced from a low of 305 bp in an Invesco-managed CLO to a high of 424 bp in a Marble Point-managed CLO (Exhibit 3). A unit change of managers’ beta cost an approximate 228 bp widening of the ‘BBB’ spread compared to the 35 bp in ‘AAA’.
Exhibit 3: ‘BBB’ spreads also inched wider with manager beta
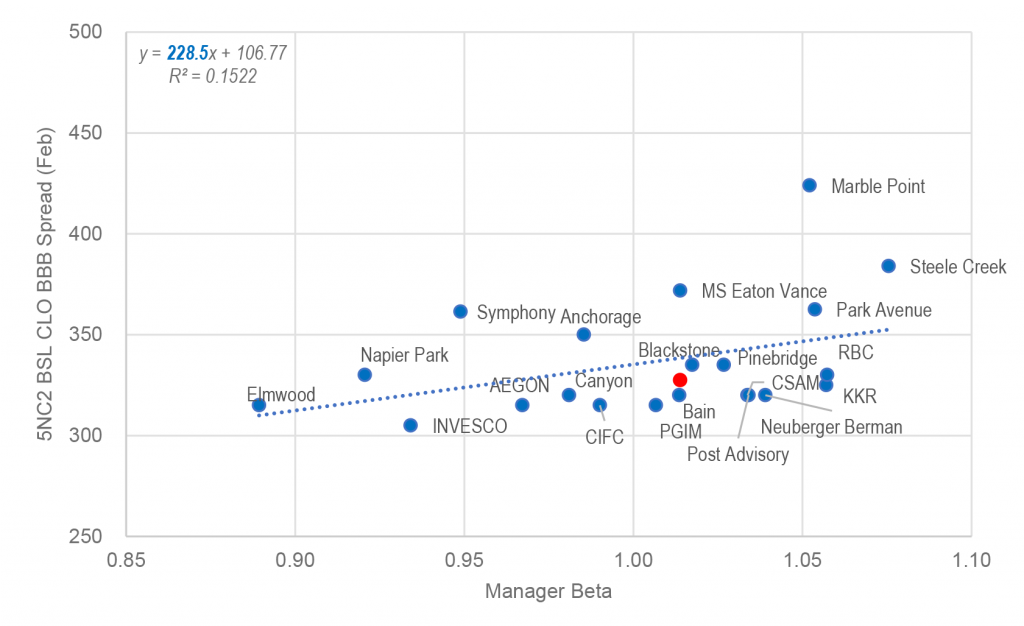
Note: Due to managers’ short performance history, the APS model does not calculate the beta for Diameter capital, Franklin Advisors, and Gulf Stream Asset Management. Their deals are excluded from the analysis. PGIM and Symphony, each issued two BSL CLOs in February, and their average ‘BBB’’ spreads were used in the analysis. For managers issued multiple ‘BBB’ tranches in a deal, the weighted average spread is used in the analysis. The red dot represents the median value in February.
Source: Bloomberg, Amherst Pierpont Securities
Looking at the primary market pricing data from January to September, it is clear investors’ are more responsive to managers’ portfolio risk or beta when it comes to pricing of lower-rated tranches (Exhibit 4).
Exhibit 4 ‘BBB’ new issue spreads are more responsive to a unit change in beta
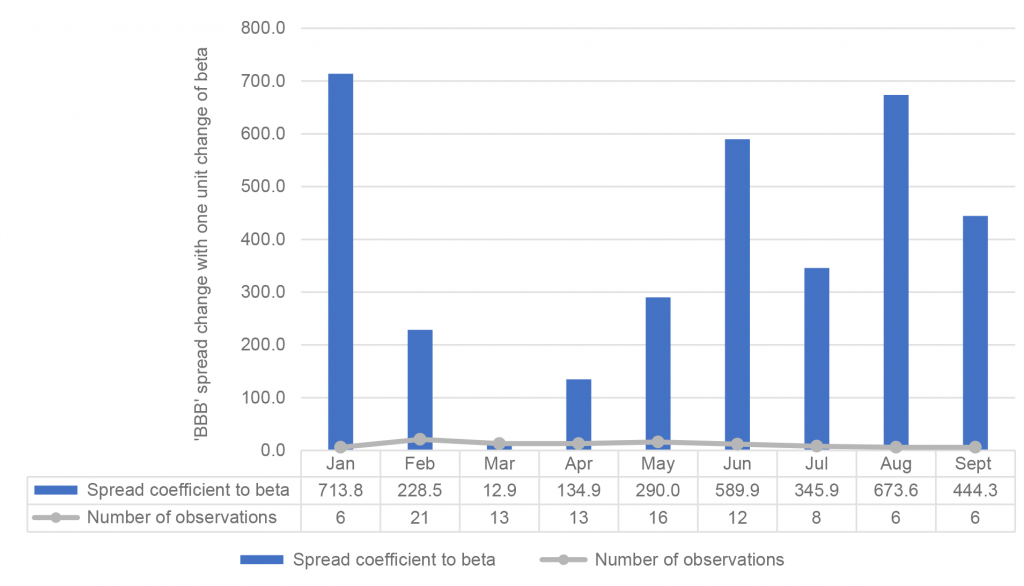
Note: Regressions have managers’ beta as independent variables (X) and new issue ‘BBB’ spread as dependent variables (Y). The coefficients to beta indicate the steepness of the trend line. To eliminate the structure influence on debt spread, the exhibit only includes managers issued 5NC2 BSL CLOs. Deals from AGL Credit, Diameter Capital, Franklin Advisors, Gulf Stream, and GSAM are excluded from analysis due to no beta value. September new issuance as of September 16, 2022.
Source: Bloomberg, Amherst Pierpont
In parallel to the ‘AAA’ case, liquidity influenced the pricing of lower-rated debt in February as well. Take Neuberger Berman again as an example, investors priced its $36 million, ‘BBB-‘ tranche at 320 bp over SOFR in February, 8 bp tighter than the median of ‘BBB’ debt from peer managers in that month despite its relatively high beta.
The reason beta should have a bigger impact on ‘BBB’ than on ‘AAA’
A ‘BBB’ class is clearly more vulnerable to credit risk than a ‘AAA’ class. And investors need to have more compensation for the additional risk. But beta magnifies the usual difference in risk between ‘BBB’ and ‘AAA’. A higher beta means a CLO portfolio will swing around in value much more, raising the chances it dips below the value needed to cover junior or mezzanine classes. In a ‘AAA’ class, however, the subordination is so high that even significant differences in beta make small differences in the risk of the senior class. Therefore, a unit change of managers’ portfolio beta should correspond to larger spread movements in ‘BBB’ than ‘AAA’ CLOs.
Questionable value in using frequent issuance to proxy liquidity
Investors often believe debt from frequent issuers has better liquidity, but that conventional wisdom may be overvalued. Managers who are frequent issuers mostly have sizable CLO AUM and a large amount of outstanding CLO debt. By nature, they will show up more often in bid-wanted-in-competition, or BWIC, lists. But recent work by Amherst Pierpont shows that once debt shows up on a BWIC, the chances that it actually trades is roughly equal whether the issuer is small or large. In other words, once debt appears on a BWIC, liquidity across small or large issuers is roughly equal. That holds in ‘AAA’ through ‘BB’.
Investors should definitely use manager portfolio beta to determine fair value up and down the capital stack. But market pricing of assumed liquidity is an opportunity. Buy the names above the beta-to-spread trend line.