


The Long and Short
Homebuilders as bellwethers for US housing
Dan Bruzzo, CFA | September 23, 2022
This material is a Marketing Communication and does not constitute Independent Investment Research.
No place in the investment grade corporate bond market depends on housing more than US homebuilders. And that makes homebuilders a valuable window onto the housing market itself. Builder sentiment, homes contracted and homes delivered all show the market turning. Over the last two quarters, homebuilders have revised down guidance as rising interest rates reduce demand. But with highly improved balance sheets and stronger overall credit profiles since the Global Financial Crisis, builders appear extremely well-equipped for the operational challenges that lie ahead. Spreads may widen as rate pressure persists, but investors should still find good relative value in investment grade homebuilder credit.
Housing signals from the homebuilders
With the recent move in interest rates, the National Association of Homebuilders monthly index recently fell below 50, indicating more US homebuilders view conditions as poor instead of good (Exhibit 1). This is not quite the precipitous drop observed ahead of the financial crisis, but a key threshold for sentiment in the industry. Over time sentiment moves in the opposite direction as interest rates.
Exhibit 1. Homebuilder sentiment and 30-year fixed mortgage rates
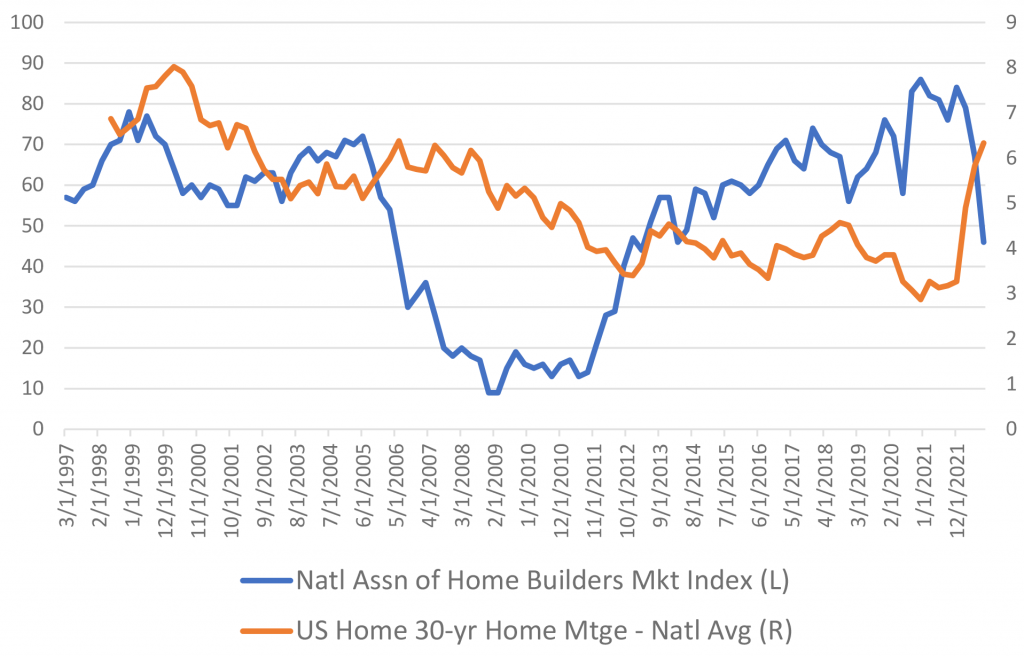
Source: Amherst Pierpont, Bloomberg LP, BankRate.com, Nation Association of Homebuilders
Not surprisingly, homebuilder spreads demonstrate a very distinct correlation to new home sales, with spreads gapping out during periods when sales are dropping (Exhibit 2). This was most evident in the period leading up to the Global Financial Crisis and has again materialized with broader credit markets moving wider.
Exhibit 2. Homebuilder spreads and new home sales
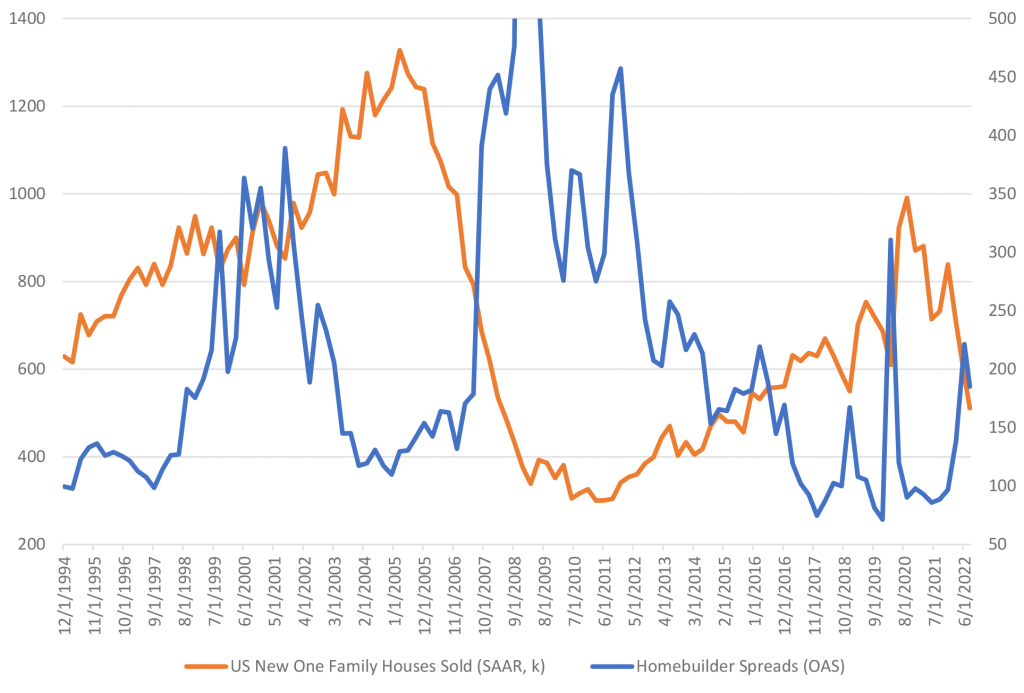
Source: Amherst Pierpont, Bloomberg LP
Right Y-Axis compressed for visual purposes, peak reaches >1,000
Homebuilders compared to the broad investment grade market
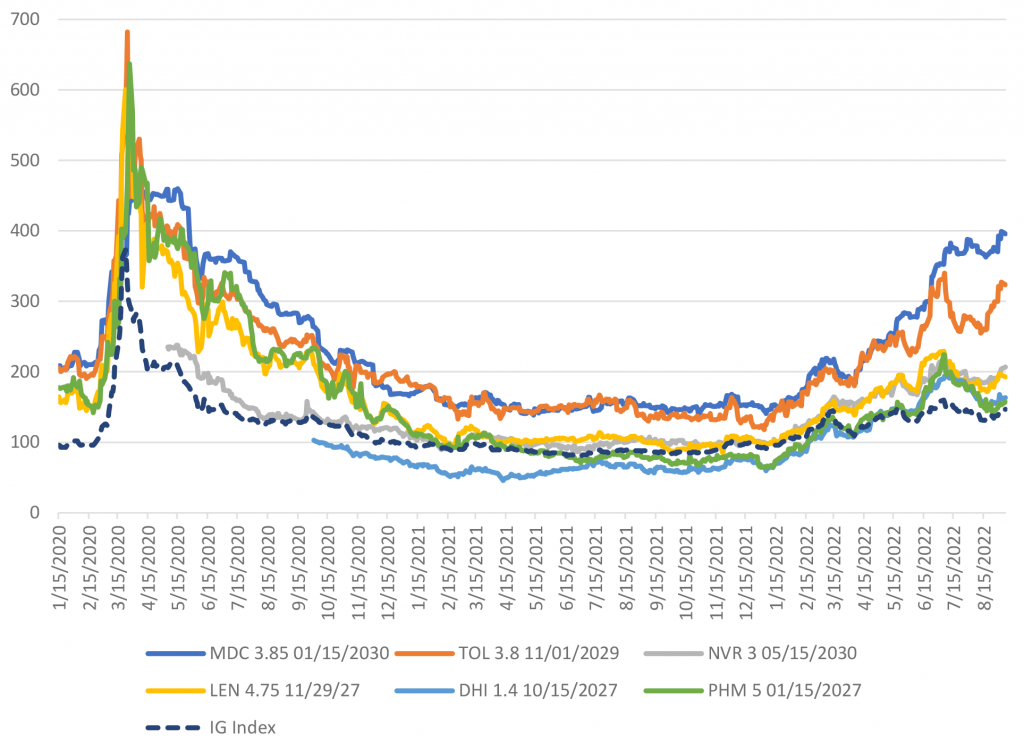
Historically, investment grade homebuilder spreads demonstrate more sensitivity to periods of housing dislocation—most notably during the US housing crisis and again when mortgage rates temporarily moved higher both in 2010 and later in 2013 (the “taper tantrum”) (Exhibit 3). With steady balance sheet improvement and survivorship bias in the homebuilder space, those operators remaining with high grade credit profiles have demonstrated greater stability during the more recent bouts of broader credit spread widening (such as the heights of the global pandemic, given extremely low interest rates).
Exhibit 3: Homebuilder OAS and the IG corporate bond index OAS
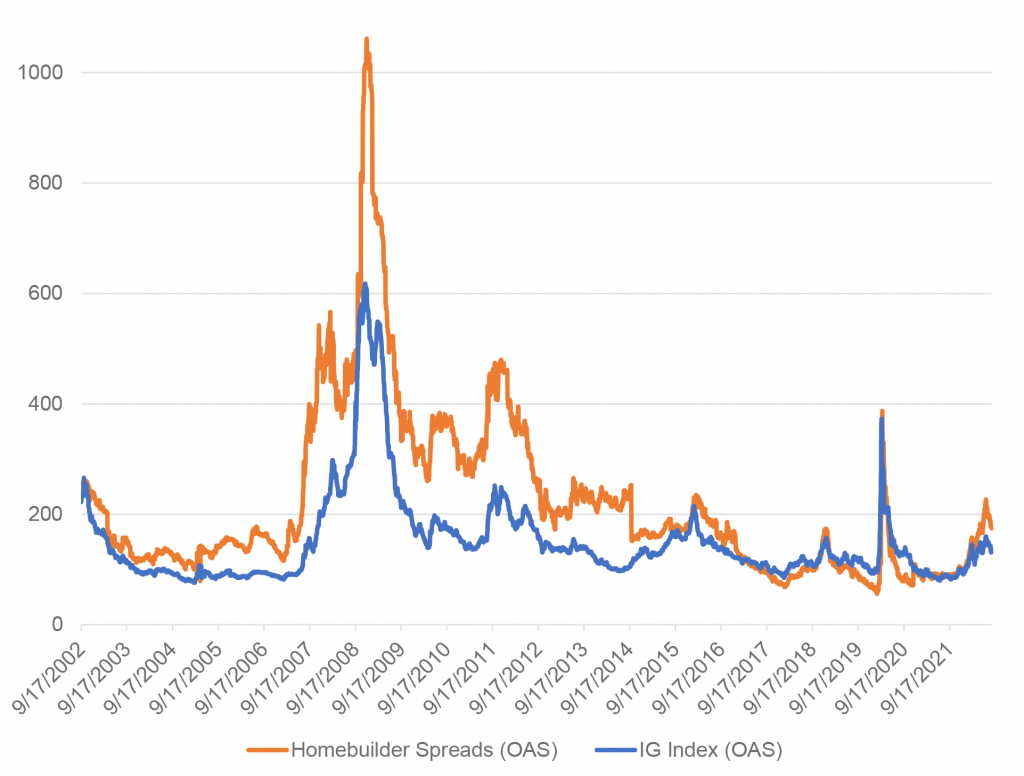
Source: Amherst Pierpont, Bloomberg
Stronger homebuilder balance sheets
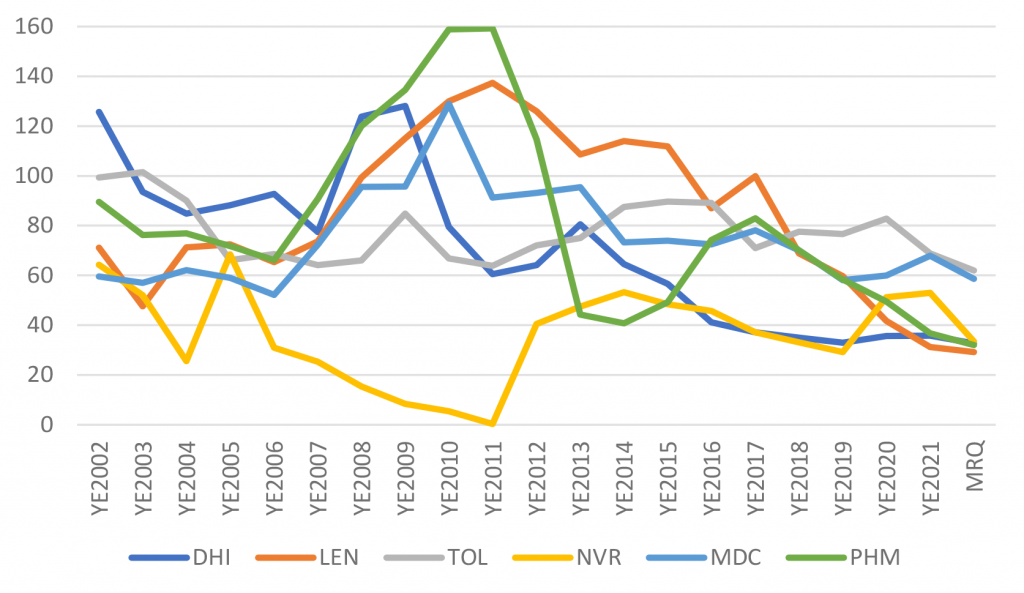
With only a few exceptions, leverage among the investment grade homebuilders as measured by total debt-to-EBITDA has steadily improved since the post-crisis fallout years of 2010 to 2011 (Exhibit 4)
Exhibit 4: Investment grade homebuilder leverage
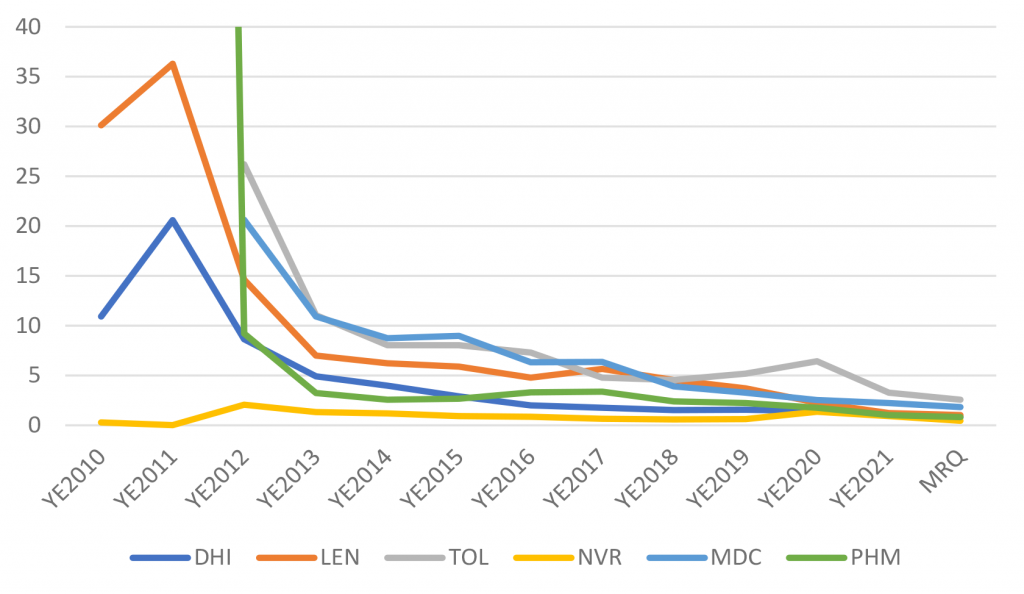
Source: Amherst Pierpont, Bloomberg, company filings
Left Y-axis compressed for visual purposes
Debt-to-equity ratios among the homebuilders have also been steadily improving off their post-crisis peaks, which demonstrates that progress is not purely a function of better cash flows but a more conscious effort on the part of management teams to maintain conservative balance sheets (Exhibit 5).
Exhibit 5: Investment grade homebuilder debt-to-equity
Source: Amherst Pierpont, Bloomberg, company filings
Operating metrics moderating but still solid historically
Looking at the six largest investment grade issuers in the homebuilder segment, the number of homes contracted has begun moderating over the past two years after an extensive decade-plus period of consistent growth. With recent rate pressures, management teams are revising down guidance and carefully controlling inventories to avoid having to materially boost incentives (Exhibit 6).
Exhibit 6. Investment grade homebuilder new homes contracted
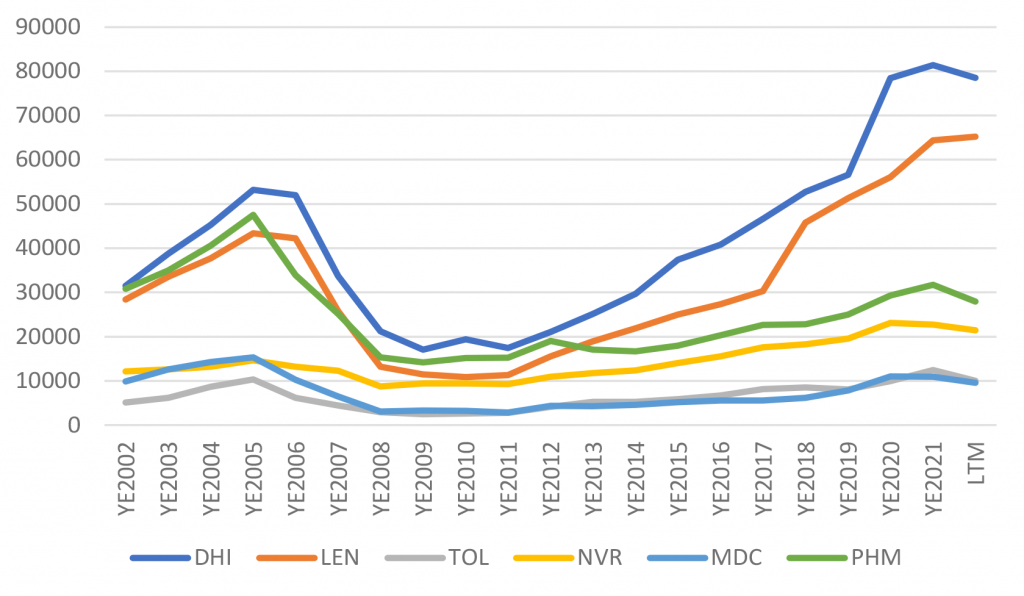
Source: Amherst Pierpont, Bloomberg
Similarly, home deliveries have been softening and even declining in the case of industry leader DR Horton (DHI) (Exhibit 7). It is worth noting that this tempering of activity comes off historic peaks; in particular, the ramp up in sales that is visible on the graphics immediately following the heights of the global pandemic. Furthermore, homebuilders are doing a better job than ever of managing down inventory, to limit incentives necessary to bolster deliveries.
Exhibit 7: Investment grade homebuilder new homes delivered
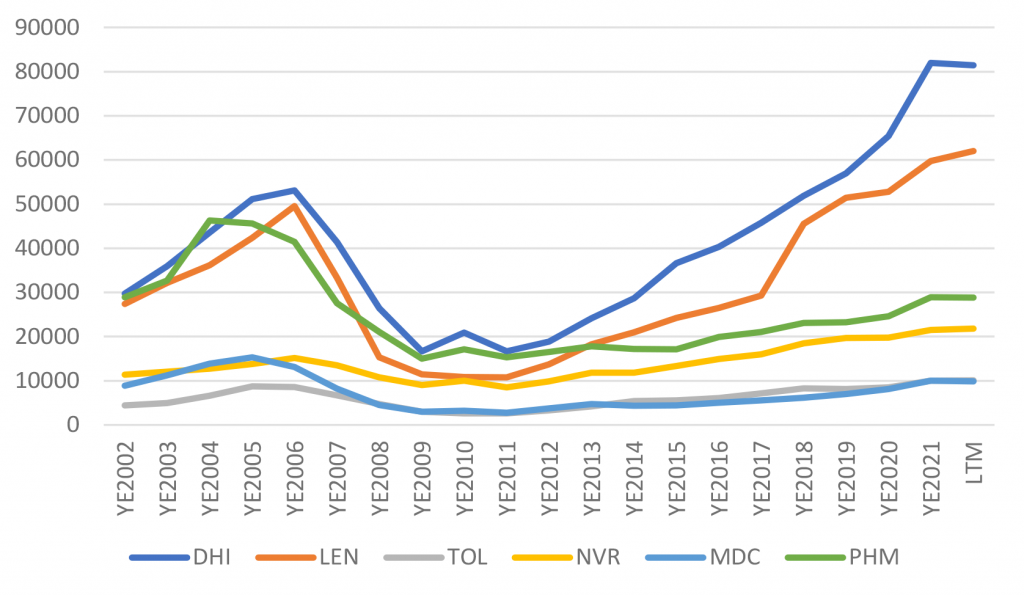
Source: Amherst Pierpont, Bloomberg
Individual IG homebuilder bellwethers
DR Horton Inc. (DHI: Baa1/BBB/BBB+)
DHI is among the largest and most well-diversified homebuilders in the US, providing a broad market view from which to judge the housing landscape. In the most recent quarterly results (F3Q22 on 7/21), DHI mostly notably reported weaker than expected orders and lowered its expectations for home deliveries for the full year. Purchase contracts declined 7% YoY to 16,693, well below the consensus estimate. Meanwhile, management revised their forecast for deliveries to 83,000 to 85,000 from its previous expectations for 88,000 to 90,000. Home closings in the quarter were 21,308, which fell just short of the range of company expectations. The cancellation rate increased to 24% from 17% in the prior year period, although it’s worth nothing that cancellations had been running uncharacteristically low post pandemic and the increase represents a return to a more normalized run rate (albeit somewhat elevated). The bottom-line is that DHI maintains a very strong balance sheet and has tempered new builds to manage down existing inventory and appears well-positioned to weather the downtick in market activity.
Lennar (LEN: Baa2/BBB-/BBB)
LEN is firmly positioned as the second largest homebuilder in the US with current annual revenue of just under $30 billion on an LTM basis. The company reported its most recent quarterly results (F2Q22) on June 22, and while a month earlier, they were far more optimistic than their larger rival DHI. New orders rose 4% to 17,792 while deliveries increased 14% to 16,549. Management maintained their guidance for full-year deliveries of 68,000. The cancellation rate in the F2Q22 was just 11.8%, remaining below its more typical level closer to 15%. While results were viewed mostly favorably and in-line with expectations there was still evidence that demand was waning and price increases were stalling, as management acknowledged these challenges. Noteworthy is Moody’s decision to upgrade of LEN to Baa2 from Baa3 last month (after these concerns were already raised), reflecting the company’s strong market position as well as its conservative balance sheet management, which tempers the potential impact of continued operating challenges on the horizon.
PulteGroup Inc. (PHM: Baa2/BBB-/BBB)
PHM is among the credits that have only recently moved back into the investment grade rating spectrum over the past few years. Moody’s first raised the rating to Baa3 in 2020, joining Fitch to provide the company with an IG ratings profile. S&P brought the rating back to IG in 2021. PHM is the third largest IG issuer with a geographic footprint that spans 25 states. The company last reported quarterly results (F2Q22) on July 26. Net new orders were down 8% from the prior year period, while the backlog value increased 18% year-over-year. The cancellation rate increased to 15% from 7% in the second fiscal quarter of 2021, but similar to the peer group appears to be returning to a more normalized run rate from the low levels of the post pandemic period. Closings were 7,177 which was only down modestly from 7,232 in the prior year period. Management believes that they are well positioned to meet the operational challenges that lie ahead, stressing their efficient building practices and financial strength.
NVR Inc. (NVR: Baa1/BBB+/BBB+)
NVR is less geographically diversified than its larger, investment grade rivals. The company operates primarily in more metropolitan areas with concentrations in the Mid-Atlantic states, the Mid/North-East US and the Southeast. Still, this more regionalized viewpoint provided a similar outlook of the industry, with rate pressures moderating demand, when the company reported F2Q22 results on July 27. New orders fell 16% from the prior year period to 4,663, while the cancellation rate increased to 14% from a compressed level of 8% in F2Q21. Margins were up favorably as settlement prices were elevated.
Toll Brothers Inc. (TOL: Baa3/BB+/BBB-)
TOL provides us with insight into the US luxury new housing market. The company last reported quarterly results (F3Q22) on August 23. EPS and total revenue both missed analysts’ estimates. Management cut their forecast for FY2022 deliveries to 10,000 to 10,300 from 11,000 to 11,500, which was below consensus expectations. Total home sales in F3Q22 were 2,414 down 7% YoY. The cancellation rate increased to 1.6% from 1.0%. Management highlighted a significant decline in demand in the higher end market as mortgage rates rose rapidly and home prices increased. This was a fairly material step-down in performance and messaging from the prior quarter. In that prior period, TOL beat expectations and management back then simply noted that demand had come down slightly from the highly elevated pace of the prior two years.
MDC Holdings Inc. (MDC: Ba1/BBB-/BBB-)
MDC is among the smaller investment grade homebuilders included in this report, but still among biggest IG operators in the US. The company represents a bit of a more regional player selling single-family homes in select markets that include Colorado, Virginia, Maryland, California, Arizona and Nevada. MDC reported F2Q22 results on July 28. Unit deliveries in the second quarter were down 7% YoY to 2,536. Cancellations rose to 9.7% from 5.7% in the prior year period. Most notably, unit gross orders decreased 29% to 2,237, albeit off elevated levels from the pandemic and post-pandemic market environment. Management did not provide full-year guidance but expects deliveries in the next sequential quarter to be between 2,200 and 2,500.
Investment recommendation
Homebuilder spreads have drifted wider than the broader IG market year-to-date (Exhibit 8). We would view subsequent widening relative to other sectors on rising housing stress as an opportunity to add exposure to the segment given the stability of homebuilder balance sheets.
Exhibit 8: Investment grade homebuilder intermediate cash bond spreads
Source: Amherst Pierpont, Bloomberg/TRACE
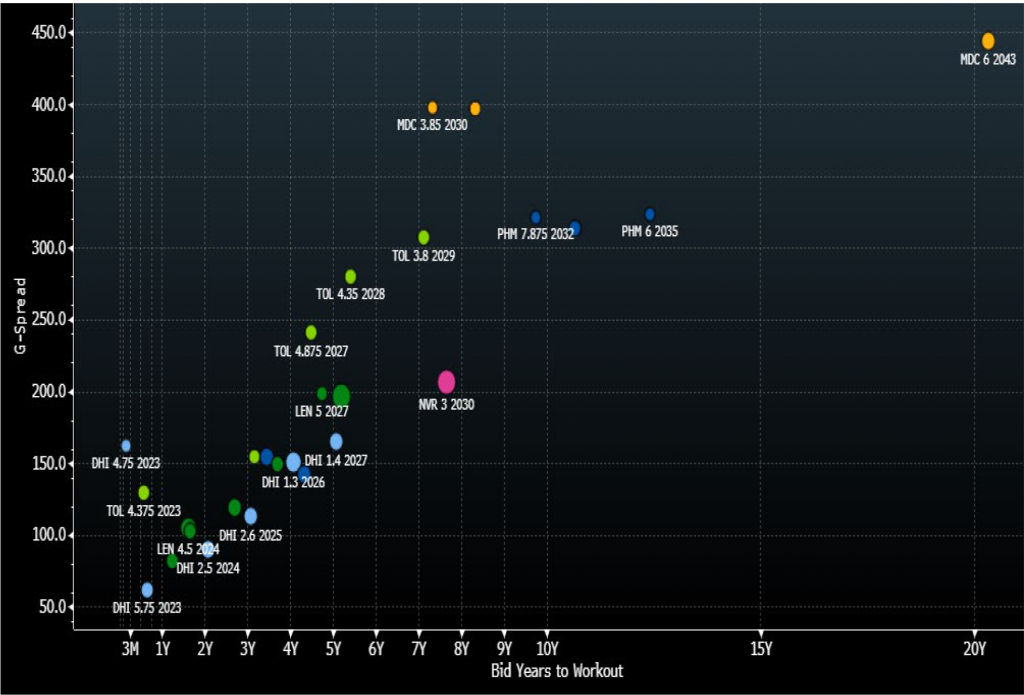
Most opportunities among the homebuilder credits lie within the short-to-intermediate part of the credit curve (Exhibit 9). And while liquidity in the secondary market can be difficult to source at times, we believe the current and near-term operating environment presents sufficient dislocation to draw out credit opportunities at attractive levels relative to broader IG at comparable ratings.
Exhibit 9: Homebuilders current bonds outstanding, G-spread indications and duration
Source: Amherst Pierpont, Bloomberg