The Big Idea
Weathering the storm
This material is a Marketing Communication and does not constitute Independent Investment Research.
Despite financial stress from stock prices that fell roughly 20% and gas prices that rose more than 20%, households managed to muddle through in the spring. Annualized real consumer spending went up in the second quarter by 1.6% without drawing down a significant portion of the extraordinary stores of household liquid assets accumulated during the pandemic. Households still have immense spending power and should be able to weather rising interest rates and a moderating economy well, at least for a while.
A tough quarter
Households dealt with difficult circumstances in the spring. The asset side of the household balance sheet took a significant hit. According to the Federal Reserve’s latest Financial Accounts of the US, household net worth sank by over $6 trillion in the second quarter, down to $143.8 trillion. This record fall was more than accounted for by a $7.7 trillion drop in the market value of households’ direct stock holdings, mutual fund positions and pension assets.
Perhaps even more damaging to consumers’ psyches and pocketbooks, gasoline prices surged due mainly to the repercussions of Russia’s invasion of Ukraine.
In the first quarter of this year, the AAA gasoline price gauge averaged $3.67 per gallon (Exhibit 1). In the second quarter, the average surged to $4.51 per gallon, with prices peaking in mid-June at just over $5 per gallon. On an annualized basis, nominal consumer spending on gasoline jumped in the second quarter by about $60 billion and, from the fourth quarter of 2021, by almost $100 billion.
Exhibit 1: AAA Regular Gasoline Prices
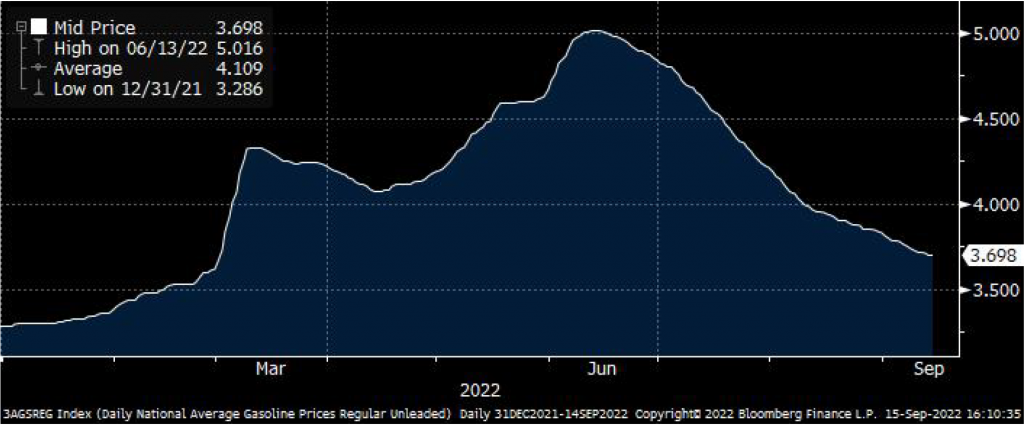
Source: AAA, Bloomberg.
Of course, inflation in the spring extended well beyond gasoline pumps. The core CPI surged by 0.6% in April, 0.6% in May and 0.7% in June. In all, prices ate up about $300 billion more on an annualized basis in the second quarter than in the first quarter—or in quarterly terms, about a $75 billion added drag on household budgets.
Muddling through
In that context, the overall performance of the consumer in the spring could be considered downright heroic. Real consumer spending advanced at a 1.6% annualized clip, not much different from the first quarter’s 1.8% rise, or the 2.25% pace of increase in the second half of last year. Households were undoubtedly bolstered by the strength in the labor market, which produced robust job gains and hefty wage hikes.
Hope for the future
As always, there are a variety of crosscurrents impacting the near-term consumer spending outlook. On the plus side, the two forces detailed above have reversed. Equity prices are somewhat higher than they were at mid-year. In addition, gasoline prices have fallen dramatically over the past three months. The current price for regular unleaded, in the vicinity of $3.70 per gallon, is back down to where it was around the beginning of March. Moreover, the level of futures prices suggests that we could see another 30 to 40 cents of declines over the next two months, which would bring the level of retail prices roughly back to where they were from October through January, before the Russian invasion of Ukraine.
However, there are other concerns for the consumer. Outside of gasoline prices, inflation remains torrid, as illustrated by August’s 0.6% jump in the core CPI. In addition, the breathtaking run-up in home prices appears to be quickly dissipating. Though a steep, prolonged drop in home values, as seen during the housing bust 15 years ago, seems unlikely, household balance sheets will probably not be boosted much by the value of real estate holdings over the next year or two.
Moreover, at some point, the Federal Reserve’s efforts to cool the economy, and in particular the labor market, will begin to bear fruit, though in the near term, labor demand appears to remain robust.
Households’ secret weapon
Notwithstanding all of these crosscurrents, perhaps the most important fundamental supporting the consumer spending outlook over the next several quarters is households’ stockpiling of liquid assets.
As I have detailed in several previous pieces, households built up their holdings of liquid assets—defined as bank deposits and money market fund shares—during the pandemic. The unprecedented fiscal largesse distributed in 2020 and 2021 as well as the inability of households to spend on certain types of services, such as international travel, spectator events and so on generated a massive increase in savings (Exhibit 2). If the pre-pandemic trend had remained in place, households would now be holding somewhere in the neighborhood of $14 trillion in liquid assets. Instead, households have about $18.5 trillion.
Exhibit 2: Household liquid assets
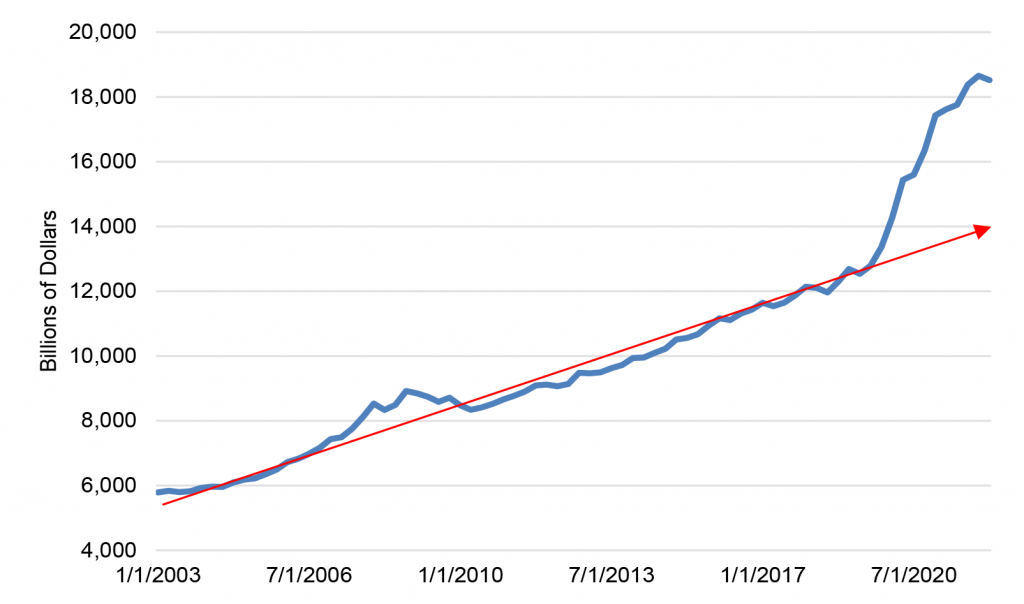
Source: Federal Reserve.
Note the scale of that extra margin of liquidity. A $75 billion hit to the consumer from inflation in the second quarter sounds like a major blow, but it fades to insignificance compared to a $4.5 trillion-dollar cushion.
My presumption has been that once the economy fully reopened, households would begin to spend down this extra margin of liquidity. The frenzy of travel in the summer may be the first installment of that process. Inflation will also continue to eat into the cushion, though as the numbers just above indicate, it would take awfully high inflation for a very long time to exhaust the extra margin of liquidity built up during the pandemic.
In any case, despite an extremely difficult environment in the second quarter, households drew down their stockpile of liquid assets by a mere $135 billion during the period. That still left them sitting pretty heading into the summer.
Savings rate confusion
Many market participants and altogether too many economists have been confused about the standing of household finances by the movements in the savings rate. During the pandemic, as liquid assets were being accumulated at an extraordinary rate, the savings rate surged. Over the last year or so, it has steadily moderated and now sits at a level modestly below pre-pandemic readings. There has been a widespread but incorrect argument that the return of the savings rate to “normal” signals that households are largely tapped out and have exhausted their pandemic windfall.
The problem with this argument is that the savings rate represents a flow, not a level. It reflects the percentage of income in a given period that is not spent, but it tells us little about the amount of accumulated assets that households hold.
To take an extreme example, let’s assume that someone wins the Mega Millions lottery and receives a check for $50 million. In the month that they deposit the check, their savings rate would spike. Then, in the next month, their savings rate would return to normal. That does not mean that the $50 million is gone. Indeed, realistically, our lucky winner would probably quit their job and their savings rate would move deep into negative territory, perhaps for the rest of their life!
Similarly, households in the aggregate are still sitting on an extra $4.5 trillion in dry powder, and a normal savings rate merely indicates that they are no longer adding to their holdings faster than the pre-pandemic trend. One could easily draw up a realistic scenario where a reopened economy would unleash a flood of pent-up spending and a period of extraordinarily low or even negative savings rates. In fact, we have not seen that yet, suggesting that households are being quite judicious despite their unusually flush positions. The likely implication is that consumer spending is not going to spike any time soon, but it will have a noticeable tailwind for a long time. This likely means that the Fed is going to have to work much harder than it otherwise would to cool the economy by enough to bring inflation under control.
This material is intended only for institutional investors and does not carry all of the independence and disclosure standards of retail debt research reports. In the preparation of this material, the author may have consulted or otherwise discussed the matters referenced herein with one or more of SCM’s trading desks, any of which may have accumulated or otherwise taken a position, long or short, in any of the financial instruments discussed in or related to this material. Further, SCM may act as a market maker or principal dealer and may have proprietary interests that differ or conflict with the recipient hereof, in connection with any financial instrument discussed in or related to this material.
This message, including any attachments or links contained herein, is subject to important disclaimers, conditions, and disclosures regarding Electronic Communications, which you can find at https://portfolio-strategy.apsec.com/sancap-disclaimers-and-disclosures.
Important Disclaimers
Copyright © 2026 Santander US Capital Markets LLC and its affiliates (“SCM”). All rights reserved. SCM is a member of FINRA and SIPC. This material is intended for limited distribution to institutions only and is not publicly available. Any unauthorized use or disclosure is prohibited.
In making this material available, SCM (i) is not providing any advice to the recipient, including, without limitation, any advice as to investment, legal, accounting, tax and financial matters, (ii) is not acting as an advisor or fiduciary in respect of the recipient, (iii) is not making any predictions or projections and (iv) intends that any recipient to which SCM has provided this material is an “institutional investor” (as defined under applicable law and regulation, including FINRA Rule 4512 and that this material will not be disseminated, in whole or part, to any third party by the recipient.
The author of this material is an economist, desk strategist or trader. In the preparation of this material, the author may have consulted or otherwise discussed the matters referenced herein with one or more of SCM’s trading desks, any of which may have accumulated or otherwise taken a position, long or short, in any of the financial instruments discussed in or related to this material. Further, SCM or any of its affiliates may act as a market maker or principal dealer and may have proprietary interests that differ or conflict with the recipient hereof, in connection with any financial instrument discussed in or related to this material.
This material (i) has been prepared for information purposes only and does not constitute a solicitation or an offer to buy or sell any securities, related investments or other financial instruments, (ii) is neither research, a “research report” as commonly understood under the securities laws and regulations promulgated thereunder nor the product of a research department, (iii) or parts thereof may have been obtained from various sources, the reliability of which has not been verified and cannot be guaranteed by SCM, (iv) should not be reproduced or disclosed to any other person, without SCM’s prior consent and (v) is not intended for distribution in any jurisdiction in which its distribution would be prohibited.
In connection with this material, SCM (i) makes no representation or warranties as to the appropriateness or reliance for use in any transaction or as to the permissibility or legality of any financial instrument in any jurisdiction, (ii) believes the information in this material to be reliable, has not independently verified such information and makes no representation, express or implied, with regard to the accuracy or completeness of such information, (iii) accepts no responsibility or liability as to any reliance placed, or investment decision made, on the basis of such information by the recipient and (iv) does not undertake, and disclaims any duty to undertake, to update or to revise the information contained in this material.
Unless otherwise stated, the views, opinions, forecasts, valuations, or estimates contained in this material are those solely of the author, as of the date of publication of this material, and are subject to change without notice. The recipient of this material should make an independent evaluation of this information and make such other investigations as the recipient considers necessary (including obtaining independent financial advice), before transacting in any financial market or instrument discussed in or related to this material.
Important disclaimers for clients in the EU and UK
This publication has been prepared by Trading Desk Strategists within the Sales and Trading functions of Santander US Capital Markets LLC (“SanCap”), the US registered broker-dealer of Santander Corporate & Investment Banking. This communication is distributed in the EEA by Banco Santander S.A., a credit institution registered in Spain and authorised and regulated by the Bank of Spain and the CNMV. Any EEA recipient of this communication that would like to affect any transaction in any security or issuer discussed herein should do so with Banco Santander S.A. or any of its affiliates (together “Santander”). This communication has been distributed in the UK by Banco Santander, S.A.’s London branch, authorised by the Bank of Spain and subject to regulatory oversight on certain matters by the Financial Conduct Authority (FCA) and the Prudential Regulation Authority (PRA).
The publication is intended for exclusive use for Professional Clients and Eligible Counterparties as defined by MiFID II and is not intended for use by retail customers or for any persons or entities in any jurisdictions or country where such distribution or use would be contrary to local law or regulation.
This material is not a product of Santander´s Research Team and does not constitute independent investment research. This is a marketing communication and may contain ¨investment recommendations¨ as defined by the Market Abuse Regulation 596/2014 ("MAR"). This publication has not been prepared in accordance with legal requirements designed to promote the independence of research and is not subject to any prohibition on dealing ahead of the dissemination of investment research. The author, date and time of the production of this publication are as indicated herein.
This publication does not constitute investment advice and may not be relied upon to form an investment decision, nor should it be construed as any offer to sell or issue or invitation to purchase, acquire or subscribe for any instruments referred herein. The publication has been prepared in good faith and based on information Santander considers reliable as of the date of publication, but Santander does not guarantee or represent, express or implied, that such information is accurate or complete. All estimates, forecasts and opinions are current as at the date of this publication and are subject to change without notice. Unless otherwise indicated, Santander does not intend to update this publication. The views and commentary in this publication may not be objective or independent of the interests of the Trading and Sales functions of Santander, who may be active participants in the markets, investments or strategies referred to herein and/or may receive compensation from investment banking and non-investment banking services from entities mentioned herein. Santander may trade as principal, make a market or hold positions in instruments (or related derivatives) and/or hold financial interest in entities discussed herein. Santander may provide market commentary or trading strategies to other clients or engage in transactions which may differ from views expressed herein. Santander may have acted upon the contents of this publication prior to you having received it.
This publication is intended for the exclusive use of the recipient and must not be reproduced, redistributed or transmitted, in whole or in part, without Santander’s consent. The recipient agrees to keep confidential at all times information contained herein.


