By the Numbers
A multifamily market shaped by lenders
This material is a Marketing Communication and does not constitute Independent Investment Research.
Not all parts of the multifamily market have equal prospects for growth ahead. Rapid growth in lending supported by Fannie Mae, Freddie Mac and Ginnie Mae along with lending by banks has meant steady growth for properties and borrowers that fit their respective underwriting. Prospects for healthy supply in that sector look good. For affordable housing, however, the supply of financing has retreated significantly. Supply in that sector looks likely to be highly constrained.
A decade of strong multifamily property price appreciation coincided with a shift in financing as the GSEs built market share in multifamily lending. The convergence of these trends has prompted some consolidation of multifamily holdings into the hands of institutional operators, primarily using lending channels of the GSEs and commercial banks. The dearth of very low-income housing is real, as direct federal or municipal government financing of public housing has plunged. The lending standards required of the GSEs and commercial banks, with only a trickle of public housing, will likely contribute to underbuilding in affordable housing and continued upward pressure on rent growth.
Multifamily mortgage financing has changed significantly since the late 1990s. Outstanding multifamily debt has risen from roughly $300 billion to approach nearly $2 trillion, with the share financed by Fannie Mae, Freddie Mac and Ginnie Mae rising from 18% to 48% (Exhibit 1). Financing from commercial banks has dropped modestly from 37% to 30%. Financing by insurers has stayed roughly around 10%. Financing from federal, state and local governments has plunged from 21% to 6%. And financing from non-agency securitization has dropped from 16% in 2007 to less than 4% today.
Exhibit 1: Multifamily mortgages outstanding
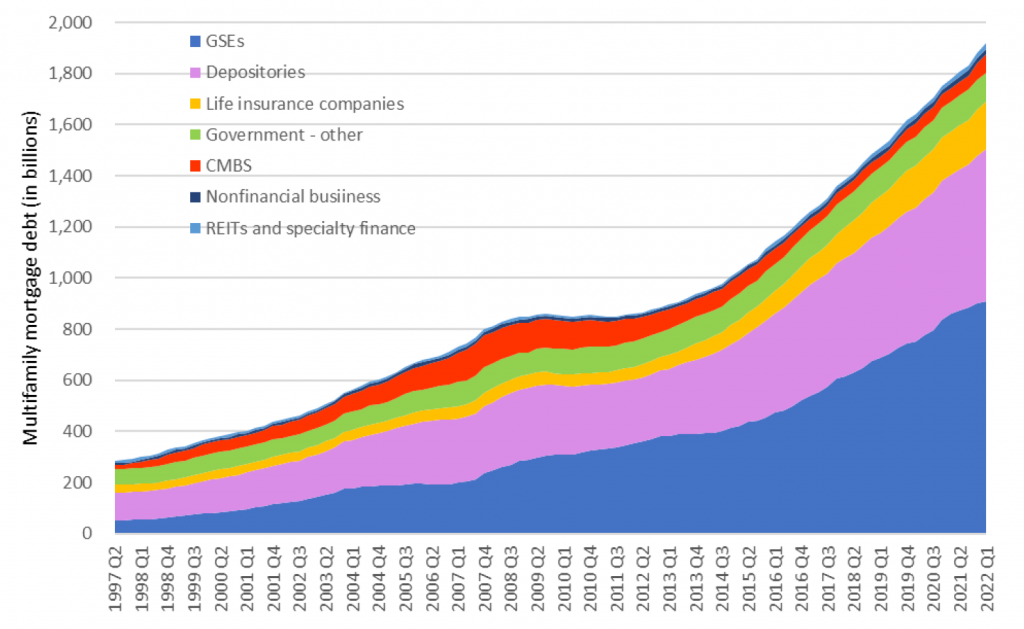
Source: Federal Reserve, Amherst Pierpont Securities
With the GSEs and commercial banks providing nearly 80% of financing, their lending standards have important impact on the shape of multifamily properties and borrowers. The GSEs and banks both maintain lending standards subject to strict capital limits and regulatory controls. The GSEs, for example, naturally prefer multifamily owners and operators with substantial track records. This gives an edge to institutional operators, who then can accumulate large portfolios with the benefit of competitive financing. Smaller, private owners still tap the banks for financing, though they are competing with the deep pockets of private equity, and private equity can operate properties on thin initial cap rates while waiting for longer-term property price appreciation to earn larger returns.
The impact of lending standards is shaping the multifamily landscape slowly. There are approximately 19 million multifamily units with an estimated asset value of $5 trillion. Private, non-institutional investors still comprise the bulk of multifamily property owners, accounting for nearly two-thirds of multifamily assets by value (Exhibit 2). Institutional operators, or those that own large portfolios of properties, account for 10% of multifamily assets, while public REITs and private equity combine for 17%. Multifamily buildings that also serve as the primary residence for the owners are 12% of the stock.
Exhibit 2: Multifamily asset value by owner type
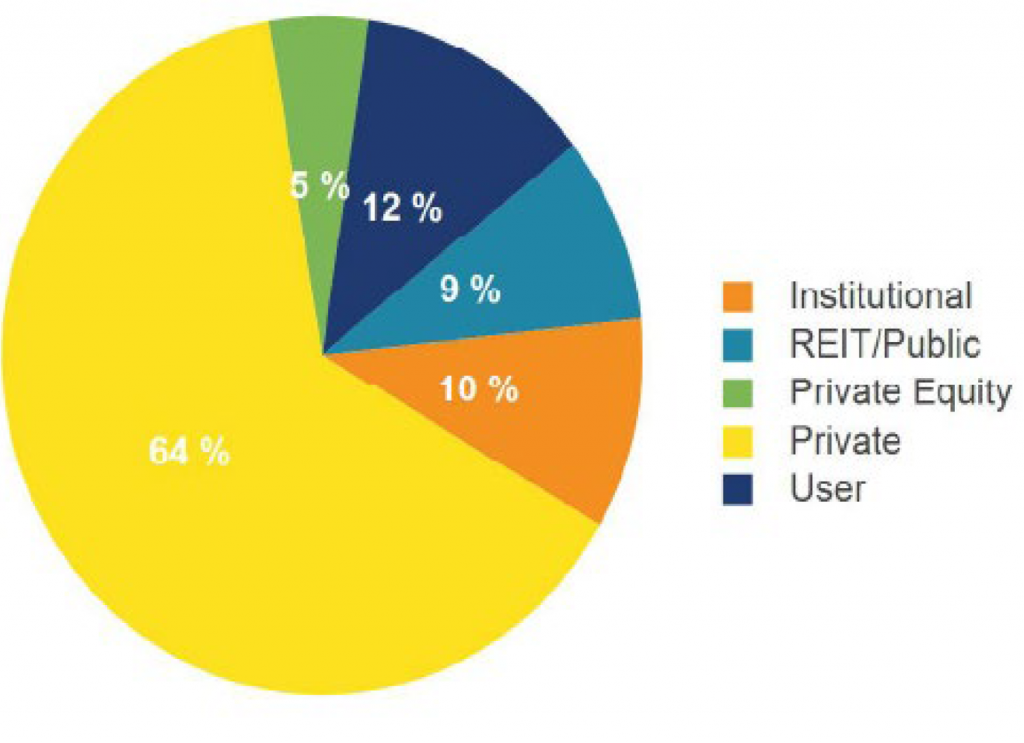
Note: Multifamily buildings are those with 5 or more units. Data as of Q2 2022.
Source: CoStar
The impact of lending standards is clearer in recent years. Multifamily transactions surged during the pandemic due to a combination of rent growth, property price appreciation and historically low costs of financing. This accelerated a marginal shift away from small, private multifamily operators towards institutional and private equity ownership (Exhibit 3).
Exhibit 3: Sales volume by buyer type over the past 12 months
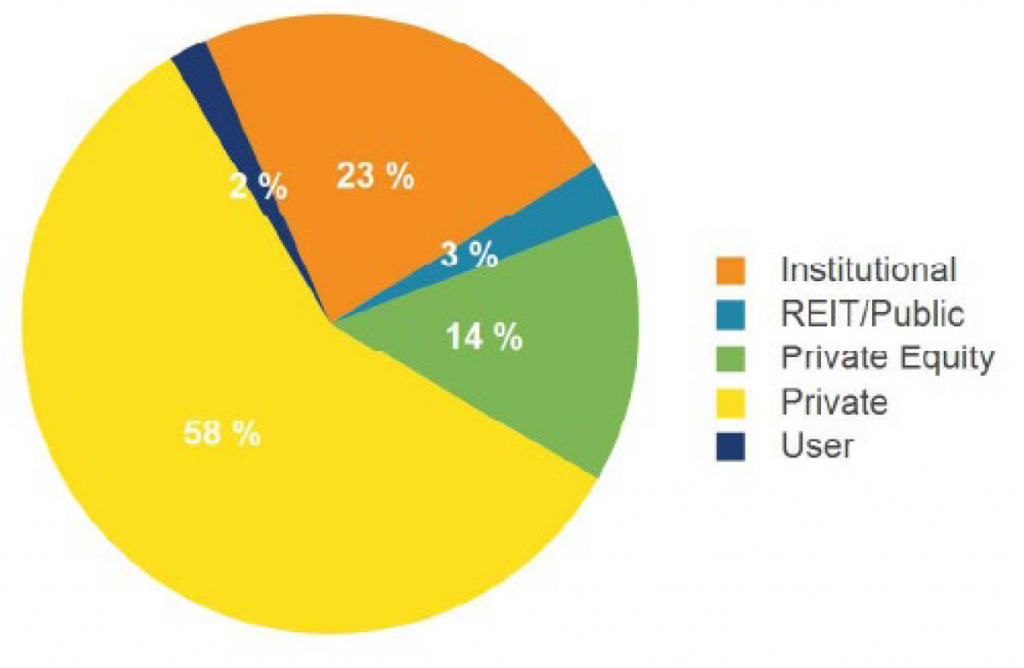
Note: Data as of Q2 2022.
Source: CoStar
Institutional and private equity firms accounted for over a third of buyers, while private owners, public REITs and users were net sellers (Exhibit 4). Part of the very recent selling by REITs can be attributed to the compression on cap rates and higher cost of financing as the Fed raised interest rates in 2022.
Exhibit 4: Net multifamily buying and selling by owner type
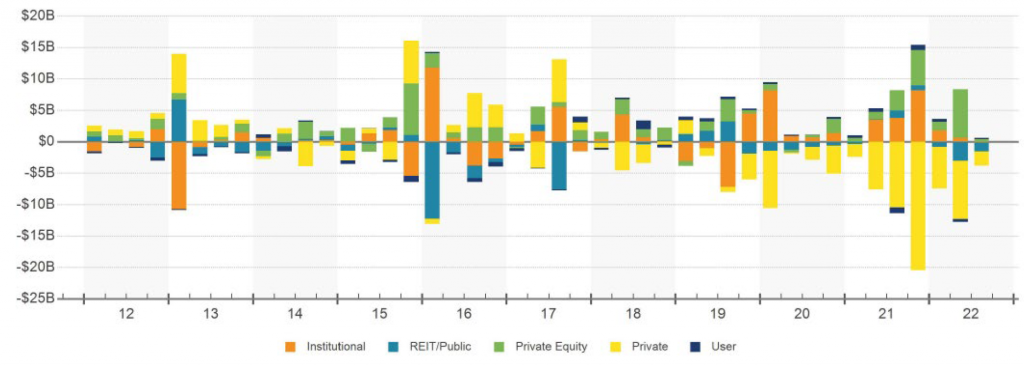
Note: Data as of Q2 2022.
Source: CoStar
GSE and bank lending is likely to continue dominating multifamily finance, so the supply of properties that fit most easily into GSE and bank underwriting is likely to grow at the fastest pace. Demand is obviously is part of the equation driving rents, but supply in properties that fit the GSEs and banks should be less of a force for rent growth.
The double whammy for affordable housing
The attrition in spending for very low-income housing is evident in the decline of federal, state and local government multifamily assets, which now barely accounts for 6% of multifamily mortgage debt outstanding. Financing affordable to moderate income housing is also considered riskier since the housing crisis tightened lending standards for banks and the GSEs. Capitalization rates for multifamily 1- to 3-star buildings, which provide the bulk of affordable housing, are higher than those for 4- and 5-star buildings (Exhibit 5). These buildings do tend to be older and require more maintenance, the tenants can have lower credit scores, and tenant turnover can be higher. Building new moderate income housing in urban areas has also run up against zoning issues and faced pushback from community organizers, which has contributed to the lack of supply.
Exhibit 5: Multifamily capitalization rates by building class
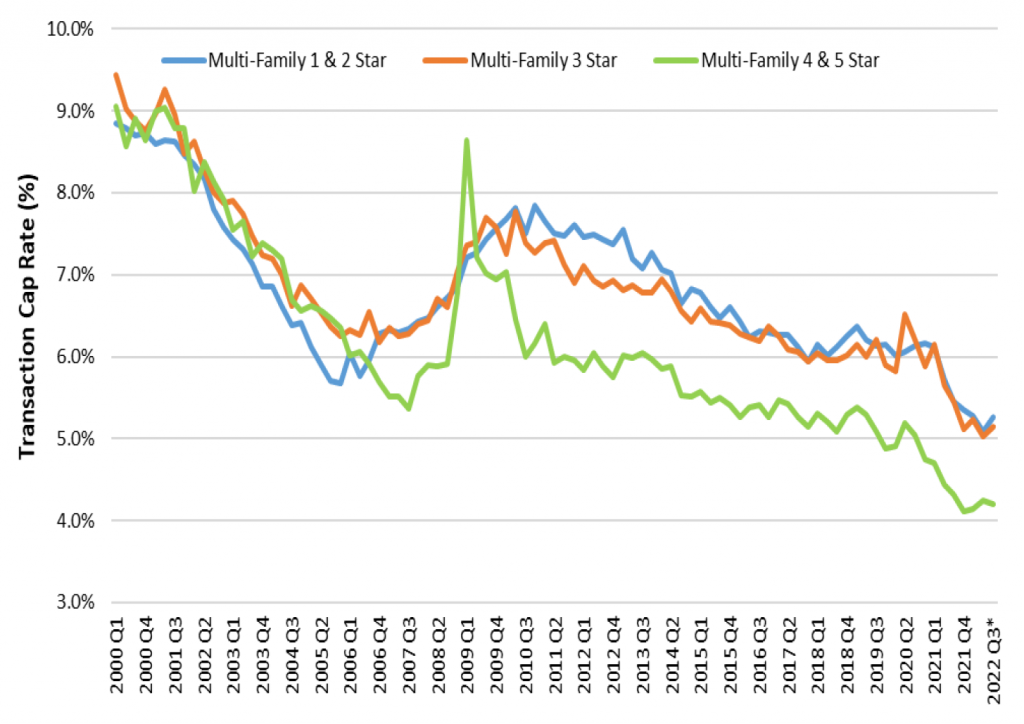
Source: CoStar, Amherst Pierpont Securities
The GSEs make important contributions to affordable housing by asking developers to include affordable units. But if the finished building stabilizes and eventually sells without new GSE financing, the new owners can turn the affordable units into market rents. The affordable housing supply encouraged by GSE policy may not be permanent.
Private developers of affordable housing face significant costs in time and money to resolve zoning disputes and navigate neighborhood activism. Strict regulatory standards also reduce the incentive for commercial banks and the GSEs to lend to smaller borrowers, and for projects that are perceived to be riskier. All these factors contribute to a low- and middle-income housing supply shortage that is not being addressed. The downside for tenants is that the supply shortage looks unlikely to resolve anytime soon. Qualifying for affordable housing loans and other programs also often requires keeping rent to a fixed percentage of area median income, so there is a limit on rent growth. But the likely lack of supply implies little margin for rents to do anything but stay at their maximum allowable level.
This material is intended only for institutional investors and does not carry all of the independence and disclosure standards of retail debt research reports. In the preparation of this material, the author may have consulted or otherwise discussed the matters referenced herein with one or more of SCM’s trading desks, any of which may have accumulated or otherwise taken a position, long or short, in any of the financial instruments discussed in or related to this material. Further, SCM may act as a market maker or principal dealer and may have proprietary interests that differ or conflict with the recipient hereof, in connection with any financial instrument discussed in or related to this material.
This message, including any attachments or links contained herein, is subject to important disclaimers, conditions, and disclosures regarding Electronic Communications, which you can find at https://portfolio-strategy.apsec.com/sancap-disclaimers-and-disclosures.
Important Disclaimers
Copyright © 2026 Santander US Capital Markets LLC and its affiliates (“SCM”). All rights reserved. SCM is a member of FINRA and SIPC. This material is intended for limited distribution to institutions only and is not publicly available. Any unauthorized use or disclosure is prohibited.
In making this material available, SCM (i) is not providing any advice to the recipient, including, without limitation, any advice as to investment, legal, accounting, tax and financial matters, (ii) is not acting as an advisor or fiduciary in respect of the recipient, (iii) is not making any predictions or projections and (iv) intends that any recipient to which SCM has provided this material is an “institutional investor” (as defined under applicable law and regulation, including FINRA Rule 4512 and that this material will not be disseminated, in whole or part, to any third party by the recipient.
The author of this material is an economist, desk strategist or trader. In the preparation of this material, the author may have consulted or otherwise discussed the matters referenced herein with one or more of SCM’s trading desks, any of which may have accumulated or otherwise taken a position, long or short, in any of the financial instruments discussed in or related to this material. Further, SCM or any of its affiliates may act as a market maker or principal dealer and may have proprietary interests that differ or conflict with the recipient hereof, in connection with any financial instrument discussed in or related to this material.
This material (i) has been prepared for information purposes only and does not constitute a solicitation or an offer to buy or sell any securities, related investments or other financial instruments, (ii) is neither research, a “research report” as commonly understood under the securities laws and regulations promulgated thereunder nor the product of a research department, (iii) or parts thereof may have been obtained from various sources, the reliability of which has not been verified and cannot be guaranteed by SCM, (iv) should not be reproduced or disclosed to any other person, without SCM’s prior consent and (v) is not intended for distribution in any jurisdiction in which its distribution would be prohibited.
In connection with this material, SCM (i) makes no representation or warranties as to the appropriateness or reliance for use in any transaction or as to the permissibility or legality of any financial instrument in any jurisdiction, (ii) believes the information in this material to be reliable, has not independently verified such information and makes no representation, express or implied, with regard to the accuracy or completeness of such information, (iii) accepts no responsibility or liability as to any reliance placed, or investment decision made, on the basis of such information by the recipient and (iv) does not undertake, and disclaims any duty to undertake, to update or to revise the information contained in this material.
Unless otherwise stated, the views, opinions, forecasts, valuations, or estimates contained in this material are those solely of the author, as of the date of publication of this material, and are subject to change without notice. The recipient of this material should make an independent evaluation of this information and make such other investigations as the recipient considers necessary (including obtaining independent financial advice), before transacting in any financial market or instrument discussed in or related to this material.
Important disclaimers for clients in the EU and UK
This publication has been prepared by Trading Desk Strategists within the Sales and Trading functions of Santander US Capital Markets LLC (“SanCap”), the US registered broker-dealer of Santander Corporate & Investment Banking. This communication is distributed in the EEA by Banco Santander S.A., a credit institution registered in Spain and authorised and regulated by the Bank of Spain and the CNMV. Any EEA recipient of this communication that would like to affect any transaction in any security or issuer discussed herein should do so with Banco Santander S.A. or any of its affiliates (together “Santander”). This communication has been distributed in the UK by Banco Santander, S.A.’s London branch, authorised by the Bank of Spain and subject to regulatory oversight on certain matters by the Financial Conduct Authority (FCA) and the Prudential Regulation Authority (PRA).
The publication is intended for exclusive use for Professional Clients and Eligible Counterparties as defined by MiFID II and is not intended for use by retail customers or for any persons or entities in any jurisdictions or country where such distribution or use would be contrary to local law or regulation.
This material is not a product of Santander´s Research Team and does not constitute independent investment research. This is a marketing communication and may contain ¨investment recommendations¨ as defined by the Market Abuse Regulation 596/2014 ("MAR"). This publication has not been prepared in accordance with legal requirements designed to promote the independence of research and is not subject to any prohibition on dealing ahead of the dissemination of investment research. The author, date and time of the production of this publication are as indicated herein.
This publication does not constitute investment advice and may not be relied upon to form an investment decision, nor should it be construed as any offer to sell or issue or invitation to purchase, acquire or subscribe for any instruments referred herein. The publication has been prepared in good faith and based on information Santander considers reliable as of the date of publication, but Santander does not guarantee or represent, express or implied, that such information is accurate or complete. All estimates, forecasts and opinions are current as at the date of this publication and are subject to change without notice. Unless otherwise indicated, Santander does not intend to update this publication. The views and commentary in this publication may not be objective or independent of the interests of the Trading and Sales functions of Santander, who may be active participants in the markets, investments or strategies referred to herein and/or may receive compensation from investment banking and non-investment banking services from entities mentioned herein. Santander may trade as principal, make a market or hold positions in instruments (or related derivatives) and/or hold financial interest in entities discussed herein. Santander may provide market commentary or trading strategies to other clients or engage in transactions which may differ from views expressed herein. Santander may have acted upon the contents of this publication prior to you having received it.
This publication is intended for the exclusive use of the recipient and must not be reproduced, redistributed or transmitted, in whole or in part, without Santander’s consent. The recipient agrees to keep confidential at all times information contained herein.


