The Big Idea
A surge in wages
This material is a Marketing Communication and does not constitute Independent Investment Research.
The extreme tightness of the labor market since the early days of pandemic has generated accumulating wage gains. For a time in the spring, a string of smaller monthly increases in average hourly earnings led some analysts to speculate that wage growth was decelerating. But that slowdown proved to be a false step, as the last two readings have been faster and have come with upward revisions to previous months. Perhaps more importantly, two alternative measures of wages that avoid the composition bias, the ECI and the Atlanta Fed wage tracker, are clearly accelerating.
Average hourly earnings
The most widely followed measure of wages is the average hourly earnings gauge released in the monthly employment report. There are actually two different average hourly earnings measures. The headline figure was introduced about 15 years ago and incorporates all workers. There is a narrower version that was the main reading until the newer, broader wage measure was rolled out. The narrower gauge includes only production and nonsupervisory workers—those who actually get paid by the hour.
Given that it is difficult to measure hourly pay for salaried workers or those who are paid on commission, there is a case to be made that the narrower version of average hourly earnings is more accurate, albeit less inclusive.
In any case, for a brief time in the spring, the two measures diverged somewhat, as the broader headline gauge slowed. The initial monthly prints for average hourly earnings beginning in February were flat, +0.4%, +0.3%, +0.3%, and +0.3%. If each of those preliminary readings had held, the annualized pace of wage gains over that five-month period would have been 3.2%, a steep moderation.
The initial readings have been revised mostly higher. Those same five readings, as they now stand, are +0.1%, +0.5%, +0.35%, +0.4%, and +0.4%, which works out to a 4.3% annualized pace. Moreover, the January readings was +0.6% and the July preliminary increase was +0.5%. The annualized pace for average hourly earnings over the first seven months of the year is 4.9%, which, as it happens is exactly the same as the 12-month rise in 2021.
Moreover, the narrower average hourly earnings measure has been rising faster than the broader version. So far this year, the monthly gains include one +0.3%, three 0.4%’s, and three 0.5%’s, working out to a 5.4% annualized pace.
All in all, the average hourly earnings data do not show the deceleration that they seemed to be pointing to a few months ago, but a case could be made that the numbers point to a steady trend for wage growth. If the story ended there, the Fed could probably live with that.
Alternative measures of worker compensation
The biggest problem with the average hourly earnings data is that they are subject to compositional bias. The gauge calculates the average wage of all of the workers that happen to be employed in a particular month, so the mix is always changing. We saw extreme examples of the potential bias during the pandemic. The bulk of the jobs that were lost early in the pandemic were in the bottom half of the pay scale, so the average wage shot up in the spring of 2020 and then sank in the summer, when the majority of those workers began to return.
Alternative measures of wages avoid that issue. The Employment Cost Index takes a quarterly snapshot of a fixed basket of job descriptions. For years, it barely moved, leading market participants to largely ignore the release. Starting last year, the ECI has begun to accelerate sharply.
It helps to look at the quarterly changes in the headline ECI, which includes both wages and salaries and benefits, and the wage and salary component (Exhibit 1). The increases accelerated markedly last summer and have remained elevated through mid-2022.
Exhibit 1: ECI quarterly increases
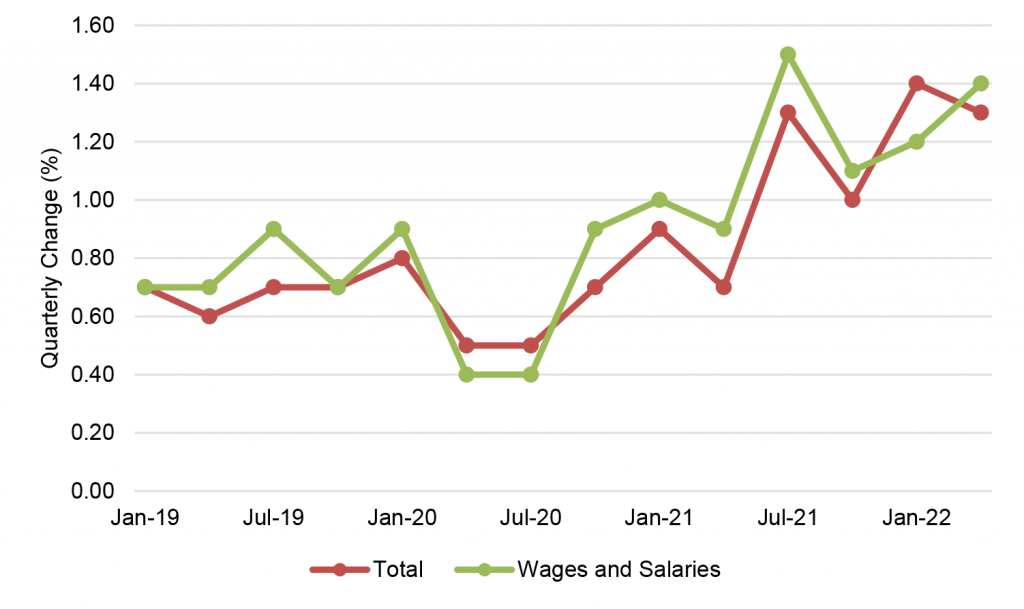
Source: BLS.
Then look at the year-over-year advances for the headline ECI and the wage and salary component (Exhibit 2). Unlike the average hourly earnings figures, which surged much earlier in the pandemic but have been much closer to flat on a year-over-year basis over the last several quarters, the ECI points to an ongoing substantial acceleration in labor cost inflation.
Exhibit 2: ECI year-over-year growth
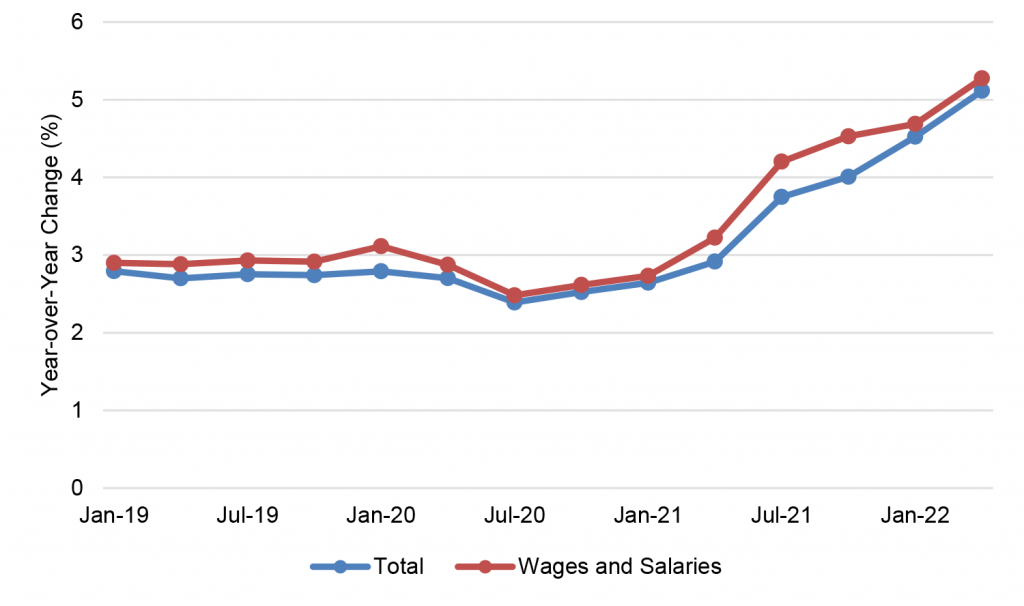
Source: BLS.
Another alternative wage measure that offers a unique perspective is the Atlanta Fed wage tracker. This gauge is derived from the Household Survey within the monthly Employment Report. This survey has a rotating panel, so not everyone participates every month. For a subset of the respondents, the Labor Department captures a wage reading for the latest month and a reading for the year-earlier month. As a result, like the Case-Shiller or FHFA home price index, this gauge allows a true apples-to-apples comparison. It measures the same person’s wages on a year-over-year basis. The downside is that the sample size is smaller than for the broader average hourly earnings measures.
Similar to the ECI, the Atlanta Fed wage tracker began to accelerate in earnest around the middle of last year and has been heating up since then (Exhibit 3). The gauge reached 6.7% in June and held there in July, exceeding the most recent corresponding readings for other wage indicators.
Exhibit 3: Atlanta Fed wage tracker year-over-year growth
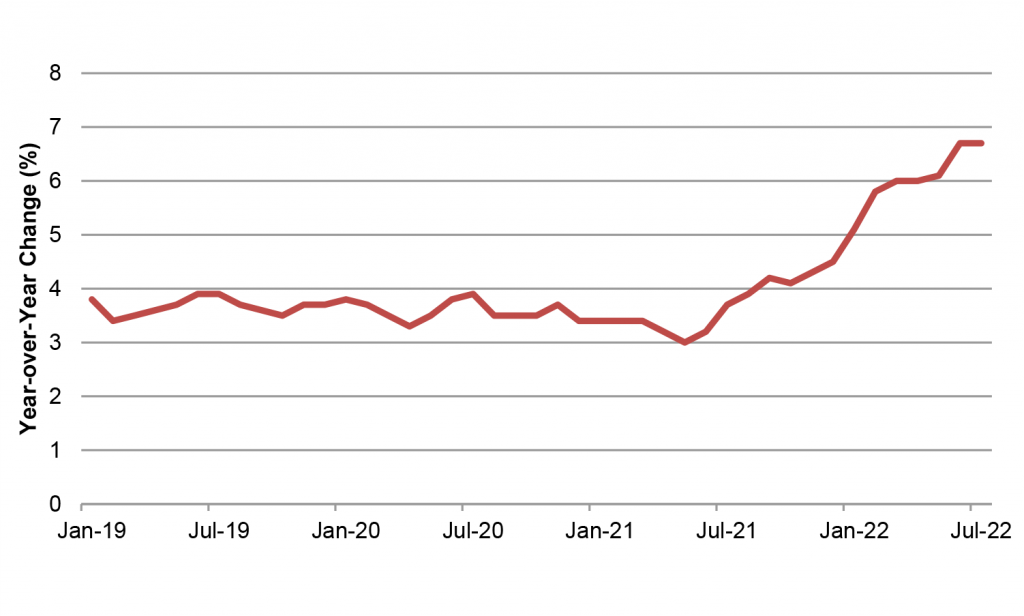
Source: Federal Reserve Bank of Atlanta.
Looking at all of the wage data carefully, my conclusion is that pay gains are probably still accelerating. This should not be a particularly surprising finding, as the labor market remains extremely tight. While the demand for labor may be moderating at the margin, there is still a substantial imbalance between supply and demand in the labor market, which should, and appears to be, leading to accumulating wage pressures. It will be difficult for the Fed to bring underlying inflation down as long as the labor market is adding to upward price pressures.
This material is intended only for institutional investors and does not carry all of the independence and disclosure standards of retail debt research reports. In the preparation of this material, the author may have consulted or otherwise discussed the matters referenced herein with one or more of SCM’s trading desks, any of which may have accumulated or otherwise taken a position, long or short, in any of the financial instruments discussed in or related to this material. Further, SCM may act as a market maker or principal dealer and may have proprietary interests that differ or conflict with the recipient hereof, in connection with any financial instrument discussed in or related to this material.
This message, including any attachments or links contained herein, is subject to important disclaimers, conditions, and disclosures regarding Electronic Communications, which you can find at https://portfolio-strategy.apsec.com/sancap-disclaimers-and-disclosures.
Important Disclaimers
Copyright © 2026 Santander US Capital Markets LLC and its affiliates (“SCM”). All rights reserved. SCM is a member of FINRA and SIPC. This material is intended for limited distribution to institutions only and is not publicly available. Any unauthorized use or disclosure is prohibited.
In making this material available, SCM (i) is not providing any advice to the recipient, including, without limitation, any advice as to investment, legal, accounting, tax and financial matters, (ii) is not acting as an advisor or fiduciary in respect of the recipient, (iii) is not making any predictions or projections and (iv) intends that any recipient to which SCM has provided this material is an “institutional investor” (as defined under applicable law and regulation, including FINRA Rule 4512 and that this material will not be disseminated, in whole or part, to any third party by the recipient.
The author of this material is an economist, desk strategist or trader. In the preparation of this material, the author may have consulted or otherwise discussed the matters referenced herein with one or more of SCM’s trading desks, any of which may have accumulated or otherwise taken a position, long or short, in any of the financial instruments discussed in or related to this material. Further, SCM or any of its affiliates may act as a market maker or principal dealer and may have proprietary interests that differ or conflict with the recipient hereof, in connection with any financial instrument discussed in or related to this material.
This material (i) has been prepared for information purposes only and does not constitute a solicitation or an offer to buy or sell any securities, related investments or other financial instruments, (ii) is neither research, a “research report” as commonly understood under the securities laws and regulations promulgated thereunder nor the product of a research department, (iii) or parts thereof may have been obtained from various sources, the reliability of which has not been verified and cannot be guaranteed by SCM, (iv) should not be reproduced or disclosed to any other person, without SCM’s prior consent and (v) is not intended for distribution in any jurisdiction in which its distribution would be prohibited.
In connection with this material, SCM (i) makes no representation or warranties as to the appropriateness or reliance for use in any transaction or as to the permissibility or legality of any financial instrument in any jurisdiction, (ii) believes the information in this material to be reliable, has not independently verified such information and makes no representation, express or implied, with regard to the accuracy or completeness of such information, (iii) accepts no responsibility or liability as to any reliance placed, or investment decision made, on the basis of such information by the recipient and (iv) does not undertake, and disclaims any duty to undertake, to update or to revise the information contained in this material.
Unless otherwise stated, the views, opinions, forecasts, valuations, or estimates contained in this material are those solely of the author, as of the date of publication of this material, and are subject to change without notice. The recipient of this material should make an independent evaluation of this information and make such other investigations as the recipient considers necessary (including obtaining independent financial advice), before transacting in any financial market or instrument discussed in or related to this material.
Important disclaimers for clients in the EU and UK
This publication has been prepared by Trading Desk Strategists within the Sales and Trading functions of Santander US Capital Markets LLC (“SanCap”), the US registered broker-dealer of Santander Corporate & Investment Banking. This communication is distributed in the EEA by Banco Santander S.A., a credit institution registered in Spain and authorised and regulated by the Bank of Spain and the CNMV. Any EEA recipient of this communication that would like to affect any transaction in any security or issuer discussed herein should do so with Banco Santander S.A. or any of its affiliates (together “Santander”). This communication has been distributed in the UK by Banco Santander, S.A.’s London branch, authorised by the Bank of Spain and subject to regulatory oversight on certain matters by the Financial Conduct Authority (FCA) and the Prudential Regulation Authority (PRA).
The publication is intended for exclusive use for Professional Clients and Eligible Counterparties as defined by MiFID II and is not intended for use by retail customers or for any persons or entities in any jurisdictions or country where such distribution or use would be contrary to local law or regulation.
This material is not a product of Santander´s Research Team and does not constitute independent investment research. This is a marketing communication and may contain ¨investment recommendations¨ as defined by the Market Abuse Regulation 596/2014 ("MAR"). This publication has not been prepared in accordance with legal requirements designed to promote the independence of research and is not subject to any prohibition on dealing ahead of the dissemination of investment research. The author, date and time of the production of this publication are as indicated herein.
This publication does not constitute investment advice and may not be relied upon to form an investment decision, nor should it be construed as any offer to sell or issue or invitation to purchase, acquire or subscribe for any instruments referred herein. The publication has been prepared in good faith and based on information Santander considers reliable as of the date of publication, but Santander does not guarantee or represent, express or implied, that such information is accurate or complete. All estimates, forecasts and opinions are current as at the date of this publication and are subject to change without notice. Unless otherwise indicated, Santander does not intend to update this publication. The views and commentary in this publication may not be objective or independent of the interests of the Trading and Sales functions of Santander, who may be active participants in the markets, investments or strategies referred to herein and/or may receive compensation from investment banking and non-investment banking services from entities mentioned herein. Santander may trade as principal, make a market or hold positions in instruments (or related derivatives) and/or hold financial interest in entities discussed herein. Santander may provide market commentary or trading strategies to other clients or engage in transactions which may differ from views expressed herein. Santander may have acted upon the contents of this publication prior to you having received it.
This publication is intended for the exclusive use of the recipient and must not be reproduced, redistributed or transmitted, in whole or in part, without Santander’s consent. The recipient agrees to keep confidential at all times information contained herein.


