


The Big Idea
The return of relative value
Steven Abrahams | August 19, 2022
This material is a Marketing Communication and does not constitute Independent Investment Research.
Relative value capital is back. Or at least on its way back. After returns in fixed income posted their worst annual start in decades into June and triggered steady fund redemptions, good returns have turned the tide. Debt returns have rebounded since mid-June, and bond mutual funds and ETFs in August have posted their strongest inflows of the year. The shift should ease some fund managers’ concerns about stockpiling liquidity and allow clearer focus on asset allocation and relative value.
The Bloomberg US Aggregate Bond Index lost 11.4% through June 15, and bond mutual funds and ETFs saw more than $180 billion in net outflows, according to the Investment Company Institute. But the index since then has gained 3.3%, and funds in August have added nearly $20 billion in net assets under management.
Look for a falling price of liquidity
The shift is likely to change the price of liquidity. Mutual fund managers anecdotally had put an understandable premium on asset liquidity in purchases during the first part of the year to ease pressure from redemptions. While memory of redemptions will almost certainly linger, the value of liquidity is likely to begin falling with the turn in mutual fund flows. Less liquid assets should begin to tighten to their more liquid counterparts.
Allocating toward MBS
Mutual fund managers should be able to focus more on asset allocation and relative value. Many funds started the year overweight credit and underweight Treasury debt and agency MBS. Rising prospects of slower growth and recession have led many to cover at least the underweight in agency MBS, and MBS has outperformed credit. Since mid-June, investment grade credit has added 50 bp of excess return while agency MBS has added 132 bp.
Agency MBS has tightened significantly since its wide marks in late May and early June, and its relative value to Treasury debt is a harder case to make. But the drumbeat of speeches and media appearances from the Fed suggests fed funds will go higher and stay there longer than the market currently prices. That should revive concerns about slower growth and recession and hurt credit spreads. Until the market fully prices for a more aggressive Fed, going overweight MBS and Treasury debt and underweight credit looks like the better allocation.
More focus on relative value
Mutual funds have a good landscape for security selection in part due to the relative lack of mutual fund capital policing value in the first half of the year. In agency MBS, par or premium coupons look like better relative value along with Ginnie Mae MBS and ARMs and 20-year pools (Exhibit 1). In CMBS, longer ‘AAA’ conduit MBS is trading unusually wide to corporate benchmarks. In CLOs, ‘AAA’ classes trade wide to corporate benchmarks and look like better relative value to other classes after considering spread or return volatility. And in investment grade corporate credit, energy, utilities and finance top the relative value list.
Exhibit 1: Relative value in different parts of fixed income

Source: Amherst Pierpont Securities
A long tradition of fund flows following performance
Bond fund flows have long followed performance, rising after funds post good returns and falling after funds post bad. Fixed income lost money in late 2018 and saw outflows the next year (Exhibit 2). The market lost money again in March 2020 and saw some of the biggest redemptions in market history. And the market lost money in the first half of the year and saw redemptions until just recently. At most other points, with trailing debt performance either flat or rising, fund assets under management continued to rise. A number of studies confirm the trend and show actively managed bond mutual funds are particularly vulnerable to redemptions after bad performance.
Exhibit 2: Fund AUM typically drops after bad returns
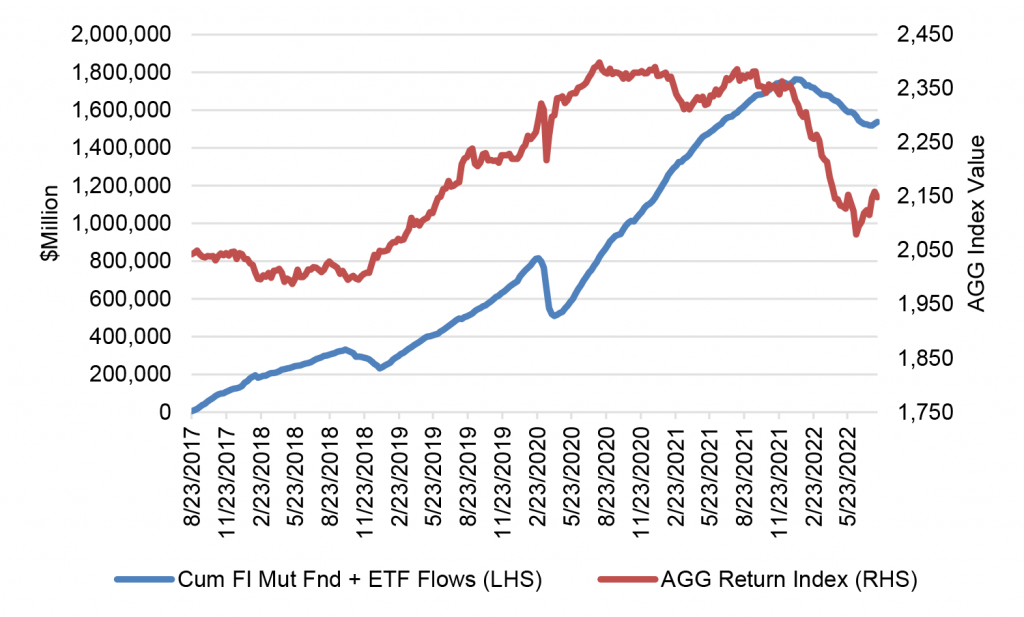
Source: ICI, Bloomberg, Amherst Pierpont Securities
Mutual funds end up more vulnerable than ETFs
In fact, a close look at fund flows shows that almost all the action—the redemptions after bad performance and the inflows after good—come from mutual funds rather than ETFs. After March 2020, for example, weekly mutual fund redemptions peaked at $213 billion while bond ETF redemptions peaked at only $16 billion (Exhibit 3). And almost all redemptions this year have come from mutual funds rather than ETS.
Exhibit 3: Actively managed bond funds are especially vulnerable to outflows
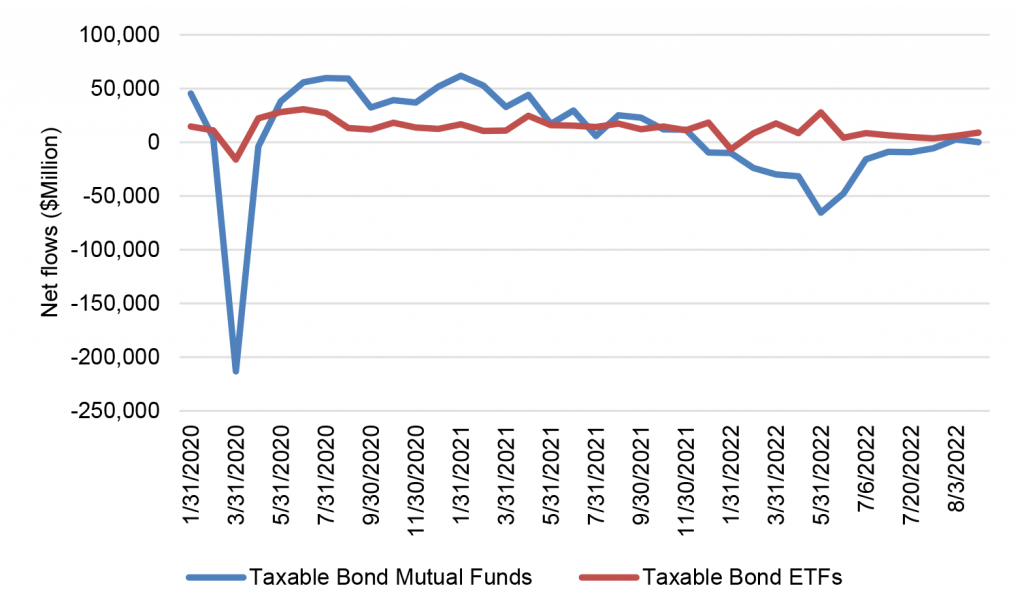
Source: ICI, Amherst Pierpont Securities
The relief from redemptions for now should give some strength to relative value trading. Actively managed mutual funds have plenty of incentive to perform. If anything, the redemptions this year made the incentive greater.
* * *
The view in rates
The 2-year note closed Friday at 3.24%, almost unchanged from a week ago. It still looks rich. The 10-year note moved on the week toward the wide end of fair value and closed at 2.97%. The 2-year rate should approach 3.50% assuming a Fed more concerned about inflation than recession. Fair value at 10-year and longer maturities still looks solidly in the neighborhood of 2.50%, but the possibility of a sustained fight with inflation may require compensation above fair value even in long maturities. The 2s10s curve looks likely to invert by around 70 bp before Fed tightening is over.
Fed RRP balances closed Friday at $2.22 trillion, insignificantly different from a week ago. Yields on Treasury bills through September continue to trade below the current 2.30% rate on RRP cash. Money market funds have little alternative but to put proceeds into RRP.
Settings on 3-month LIBOR have closed Friday at 298 bp, wider by 8 bp on the week. Setting on 3-month term SOFR closed Friday at 278 bp, also wider by 8 bp.
Breakeven 10-year inflation finished the week at 255 bp, up 8 bp from a week before. The 10-year real rate finished the week at 42 bp, higher by 7 bp.
The Treasury yield curve has finished its most recent session with 2s10s at -26 bp, flatter by 15 bp on the week. The 5s30s finished the most recent session at 12 bp, flatter by 3 bp on the week.
The view in spreads
The disconnect between Fed rhetoric on continued tightening and the easier path of fed funds implied in forward rates will have to be corrected, and that promises another round of volatility later in the year. In the meantime, volatility is coming down and spread markets are liking it. Both MBS and credit have tightened steadily since July. MBS has outperformed credit, although it looks tactically rich. As the Fed tightens and growth slows, MBS should continue outperforming. Nominal par 30-year MBS spreads to the blend of 5- and 10-year Treasury yields finished the most recent session at 132 bp, wider by 18 bp on the week. MBS OAS, on the other hand, continues to slowly tighten, suggesting good net demand. Par 30-year MBS OAS finished the week at 22 bp, wider by 18 bp on the week. Investment grade cash credit spreads have widened on the week by 5 bp.
The view in credit
Credit fundamentals have started to soften with the weakest credits showing slower revenue growth so far in 2022, declining free operating cash flow and less cash on the balance sheet. Ahead lays weaker demand, margin pressure, a soft housing market and various risks from Covid and supply interruptions. Inflation will land differently across different balance sheets. A recent New York Fed study argues inflation generally helps companies lift gross margins, although airlines and leisure may have an easier time passing through costs than healthcare, retail and restaurants. In leveraged loans, a higher real cost of funds would start to eat away at highly leveraged balance sheets with weak or volatile revenues. Consumer balance sheets look strong with rising income, substantial savings and big gains in real estate and investment portfolios. Homeowner equity jumped by $3.5 trillion in 2021, and mortgage delinquencies have dropped to a record low. But inflation and recession could take a toll and add credit risk to consumer balance sheets.