The Long and Short
Inventory woes hit profits at Target
This material is a Marketing Communication and does not constitute Independent Investment Research.
After issuing a profit warning in June, Target’s (TGT) fiscal second quarter results came in worse than anticipated, as bloated inventory levels forced management to aggressively “clear” excess merchandise. The actions led to a nearly 90% decline in earnings per share for the quarter. However, management remains confident that the second quarter profit decline is ephemeral as it affirmed full year guidance. The balance sheet remains in order and any earnings hit will not impact leverage enough to warrant a ratings event. The modest spread widening of TGT bonds in the front end of the curve should be viewed as a better buying opportunity.
TGT bond spreads have largely held in since reporting earnings, however the front end of the curve, in particular the 3-year bond, has witnessed some widening (Exhibit 1).
Exhibit 1. TGT Spread Curve (Now vs. Week Prior)
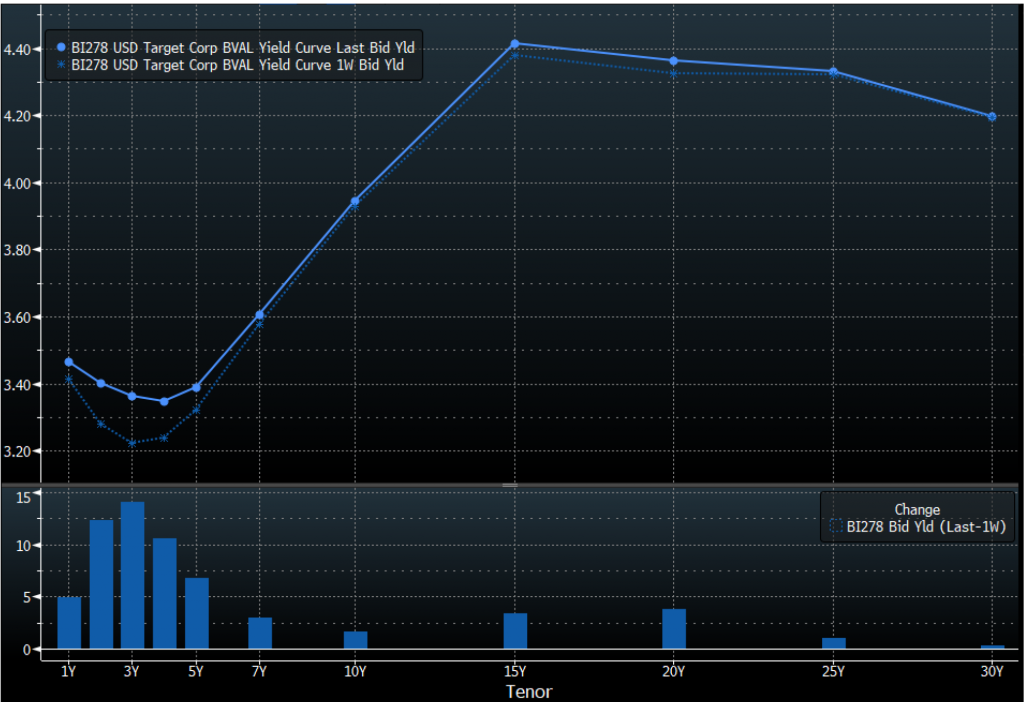
Source: Bloomberg TRACE; APS
Some Bright Spots in Second Quarter Results
The inventory clearance and write-down overshadowed some of the bright spots in TGT’s second quarter results. TGT witnessed comparable same-store-sales growth of 2.6% in the quarter, reflecting 2.7% traffic growth. This was on top of the 8.9% growth posted in the year-ago quarter. TGT also witnessed solid digital growth with digital comparable sales up 9.0% yoy, on top of 9.9% growth in second quarter of 2021. Management noted that digital growth continues to be led by the company’s same-day services, including Order Pickup, Drive Up, and Shipt. These same day services grew nearly 11% in the quarter and were fueled by the Drive Up option, which witnessed mid-teens growth. Product categories that witnessed strength in the quarter included Food & Beverage, Beauty and Household Essentials. Target derives less of its sales from the Food & Beverage category relative to its peer Walmart (WMT – Aa2/AA/AA), which explains why WMT’s inventory reduction in the quarter had less of an impact on margins versus TGT. It is estimated that nearly 50% of WMT’s sales come from the Food & Beverage category versus roughly 20% at TGT. That said, TGT had a higher percentage of discretionary inventory to clear.
Guidance Affirmed
Management noted that while they continue to plan cautiously for the year, they are optimistic about their position heading into the back half of the year. Current trends coupled with aggressive inventory actions, particularly in discretionary categories, support the company’s guidance that was released in June. This includes revenue growth in the low-to-mid-single digit area and an operating margin rate in the 6% range in the back half of the year.
With respect to the top-line guidance, TGT is comfortably in the middle of its target range based on 1H results. Looking at the operating margin, its expectation of 6% is nearly double the 3.3% operating margin witnessed in the first half of 2022. Should TGT hit the 6% operating margin rate in the third quarter, it would exceed third quarter operating margin rates posted pre-pandemic. TGT expects some spillover of inventory actions into the third quarter to the tune of $200 million. By the fourth quarter, TGT will be annualizing some significant cost headwinds which should help the yoy comparison and enable TGT to post an operating margin rate more in line with the fourth quarter rate witnessed last year (6.8%).
Credit Metrics Still in Line with Ratings
TGT ended fiscal 2021 with lease-adjusted leverage below 1.0x, which is roughly a turn lower than its historical leverage rate in the high 1.0x leverage ratio. TGT’s low leverage to start the year has provided them with a significant amount of headroom under the 2.5x leverage threshold for the ratings. We estimate TGT ended the quarter with lease adjusted leverage of 1.8x, which should will decline slightly in the back half of the year as the operating margin rate improves. TGT’s comparable store sales remains in positive territory which bodes well for the credit as the rating agencies believe that TGT’s comparable store sales would need decline in the mid-single digit area for leverage to start moving closer to that 2.5x threshold level. TGT’s management team remains very committed to their current ratings and we would expect that management would pull back on share buybacks if it needed to preserve cash or repay debt to maintain ratings. Management demonstrated its prudent financial policy during the pandemic when it dialed back share repurchases at the height of the pandemic.
This material is intended only for institutional investors and does not carry all of the independence and disclosure standards of retail debt research reports. In the preparation of this material, the author may have consulted or otherwise discussed the matters referenced herein with one or more of SCM’s trading desks, any of which may have accumulated or otherwise taken a position, long or short, in any of the financial instruments discussed in or related to this material. Further, SCM may act as a market maker or principal dealer and may have proprietary interests that differ or conflict with the recipient hereof, in connection with any financial instrument discussed in or related to this material.
This message, including any attachments or links contained herein, is subject to important disclaimers, conditions, and disclosures regarding Electronic Communications, which you can find at https://portfolio-strategy.apsec.com/sancap-disclaimers-and-disclosures.
Important Disclaimers
Copyright © 2026 Santander US Capital Markets LLC and its affiliates (“SCM”). All rights reserved. SCM is a member of FINRA and SIPC. This material is intended for limited distribution to institutions only and is not publicly available. Any unauthorized use or disclosure is prohibited.
In making this material available, SCM (i) is not providing any advice to the recipient, including, without limitation, any advice as to investment, legal, accounting, tax and financial matters, (ii) is not acting as an advisor or fiduciary in respect of the recipient, (iii) is not making any predictions or projections and (iv) intends that any recipient to which SCM has provided this material is an “institutional investor” (as defined under applicable law and regulation, including FINRA Rule 4512 and that this material will not be disseminated, in whole or part, to any third party by the recipient.
The author of this material is an economist, desk strategist or trader. In the preparation of this material, the author may have consulted or otherwise discussed the matters referenced herein with one or more of SCM’s trading desks, any of which may have accumulated or otherwise taken a position, long or short, in any of the financial instruments discussed in or related to this material. Further, SCM or any of its affiliates may act as a market maker or principal dealer and may have proprietary interests that differ or conflict with the recipient hereof, in connection with any financial instrument discussed in or related to this material.
This material (i) has been prepared for information purposes only and does not constitute a solicitation or an offer to buy or sell any securities, related investments or other financial instruments, (ii) is neither research, a “research report” as commonly understood under the securities laws and regulations promulgated thereunder nor the product of a research department, (iii) or parts thereof may have been obtained from various sources, the reliability of which has not been verified and cannot be guaranteed by SCM, (iv) should not be reproduced or disclosed to any other person, without SCM’s prior consent and (v) is not intended for distribution in any jurisdiction in which its distribution would be prohibited.
In connection with this material, SCM (i) makes no representation or warranties as to the appropriateness or reliance for use in any transaction or as to the permissibility or legality of any financial instrument in any jurisdiction, (ii) believes the information in this material to be reliable, has not independently verified such information and makes no representation, express or implied, with regard to the accuracy or completeness of such information, (iii) accepts no responsibility or liability as to any reliance placed, or investment decision made, on the basis of such information by the recipient and (iv) does not undertake, and disclaims any duty to undertake, to update or to revise the information contained in this material.
Unless otherwise stated, the views, opinions, forecasts, valuations, or estimates contained in this material are those solely of the author, as of the date of publication of this material, and are subject to change without notice. The recipient of this material should make an independent evaluation of this information and make such other investigations as the recipient considers necessary (including obtaining independent financial advice), before transacting in any financial market or instrument discussed in or related to this material.
Important disclaimers for clients in the EU and UK
This publication has been prepared by Trading Desk Strategists within the Sales and Trading functions of Santander US Capital Markets LLC (“SanCap”), the US registered broker-dealer of Santander Corporate & Investment Banking. This communication is distributed in the EEA by Banco Santander S.A., a credit institution registered in Spain and authorised and regulated by the Bank of Spain and the CNMV. Any EEA recipient of this communication that would like to affect any transaction in any security or issuer discussed herein should do so with Banco Santander S.A. or any of its affiliates (together “Santander”). This communication has been distributed in the UK by Banco Santander, S.A.’s London branch, authorised by the Bank of Spain and subject to regulatory oversight on certain matters by the Financial Conduct Authority (FCA) and the Prudential Regulation Authority (PRA).
The publication is intended for exclusive use for Professional Clients and Eligible Counterparties as defined by MiFID II and is not intended for use by retail customers or for any persons or entities in any jurisdictions or country where such distribution or use would be contrary to local law or regulation.
This material is not a product of Santander´s Research Team and does not constitute independent investment research. This is a marketing communication and may contain ¨investment recommendations¨ as defined by the Market Abuse Regulation 596/2014 ("MAR"). This publication has not been prepared in accordance with legal requirements designed to promote the independence of research and is not subject to any prohibition on dealing ahead of the dissemination of investment research. The author, date and time of the production of this publication are as indicated herein.
This publication does not constitute investment advice and may not be relied upon to form an investment decision, nor should it be construed as any offer to sell or issue or invitation to purchase, acquire or subscribe for any instruments referred herein. The publication has been prepared in good faith and based on information Santander considers reliable as of the date of publication, but Santander does not guarantee or represent, express or implied, that such information is accurate or complete. All estimates, forecasts and opinions are current as at the date of this publication and are subject to change without notice. Unless otherwise indicated, Santander does not intend to update this publication. The views and commentary in this publication may not be objective or independent of the interests of the Trading and Sales functions of Santander, who may be active participants in the markets, investments or strategies referred to herein and/or may receive compensation from investment banking and non-investment banking services from entities mentioned herein. Santander may trade as principal, make a market or hold positions in instruments (or related derivatives) and/or hold financial interest in entities discussed herein. Santander may provide market commentary or trading strategies to other clients or engage in transactions which may differ from views expressed herein. Santander may have acted upon the contents of this publication prior to you having received it.
This publication is intended for the exclusive use of the recipient and must not be reproduced, redistributed or transmitted, in whole or in part, without Santander’s consent. The recipient agrees to keep confidential at all times information contained herein.


