


The Big Idea
Discounting an early end to Fed portfolio runoff
Stephen Stanley | August 12, 2022
This material is a Marketing Communication and does not constitute Independent Investment Research.
There is growing buzz among Fed watchers that the Fed may stop shrinking its balance sheet as early as mid-2023. There is much we do not know about how the Fed will handle balance sheet normalization. After all, the Fed has done this only once from 2017 to 2019 and only announced vague guidelines in January. However, there is good reason to be skeptical that the Fed would end balance sheet runoff so soon.
Balance sheet normalization in the last cycle
The size of the Federal Reserve’s balance sheet has evolved significantly over the past 15 years. Before 2008, reserve balances were tiny, and the Fed controlled the funds rate by making small injections or withdrawals of reserves to bring the supply of reserves in line with banks’ demand. At the end of 2007, total reserves in the banking system were less than $50 billion. The Fed held a balance sheet of Treasuries, which ran less than $1 trillion and roughly offset the supply of currency in circulation, which was the main liability on the Fed’s balance sheet.
That changed in 2008. Congress authorized the Fed to pay interest on reserves. Now, it was no longer quite so inefficient for banks to hold excess reserves since they would get paid for them.
Of course, the other major development in 2008 was the Great Financial Crisis. The Fed took its federal funds rate target down to essentially zero for the first time in modern history, and then went further beginning in 2009, buying Treasury and agency debt and agency mortgage-backed securities to further stimulate the economy, “Quantitative Easing.”
Several rounds of purchases through 2014 expanded the Fed’s securities holdings dramatically. By the end of the last round of buying, the Fed’s balance sheet ballooned to roughly $4.5 trillion.
At the same time the supply of bank reserves expanded, demand increased as well. Various regulatory reform initiatives in the wake of the passage of the Dodd-Frank bill in 2010 required banks to hold more safe, liquid assets. It was well understood when the Fed finally began to normalize its balance sheet in 2017 that the appropriate level would be far higher than the pre-2008 norm. However, Fed staffers and private sector analysts could only loosely predict how large the balance sheet would need to be.
The Fed began to slowly reduce its balance sheet in late 2017 and allowed about $600 billion of securities to run off by the middle of 2019. This still left the level of securities at around $3.6 trillion, while the level of bank reserves slid from $2.3 trillion in 2017 to around $1.5 trillion in the summer of 2019.
Two things happened at roughly the same time around that time. First, after having raised the funds rate target to more than 2% by the end of 2018, a weakening economy led the FOMC to modestly lower its policy rate, beginning at the July 2019 FOMC meeting. Second, the repo market began to misbehave in the summer of 2019, suggesting that the Fed had overshot and removed too many reserves, creating a scarce liquidity in the money markets. The Fed had already announced plans to end balance sheet reduction after September 2019, but it cut the process short by two months and ended runoff in August.
How much balance sheet reduction is necessary?
The policy normalization in 2022 has, of course, been far more rapid than was the case in the 2010s. Any thought of a slow, orderly progression along the lines of the 2015-2019 period was thrown out the window when inflation surged at an alarming pace. The Fed shifted from ending QE to rate hikes to large rate hikes and balance sheet reduction in a matter of three months, from March to June.
The game plan for balance sheet normalization consequently is likely to look quite different this time than it did in the previous cycle. To start, balance sheet expansion was even more dramatic in the 2020-2022 Quantitative Easing than in the 2009-2014 period. Just before balance sheet runoff began in June, the Fed’s balance sheet was $8.9 trillion and securities holdings totaled $8.5 trillion.
For reference, at the end of 2019, the balance sheet totaled $4.2 trillion. If we assume that this was roughly the proper level of reserves for the economy, and then assume further that reserves need to grow over time at a 5% annual pace—reflecting long-run trends for real GDP growth and 2% inflation plus a margin of about 1%—then we can draw a trend line of the projected “proper” path of the size of the Fed’s balance sheet.
Then, we can use the schedule of runoff that the FOMC published in May to estimate the evolution of the actual balance sheet. In reality, the Fed has acknowledged that it probably will not hit its caps for MBS runoff in most months, and sinking prepayment speeds as mortgage rates have surged this year bear that out. Still, the Fed retains the option of selling MBS outright, so it could come close to the caps if it chose to. Think of the path laid out here as an upper limit on how fast the balance sheet can shrink. The actual pace could be slower by as much as $100 to $200 billion per year, normally a huge difference but not in this context.
The intersection of the proper path for liquidity and the Fed’s projected path of portfolio reduction says something about the supply and demand for liquidity. The two lines cross in 2025 (Exhibit 1). Chair Powell noted earlier this year that the Fed would likely halt balance sheet reduction before it reached that intersection point and let the demand for liquidity grow to reach equilibrium. This would reduce the odds of a repeat of the 2019 overshoot.
Exhibit 1: Federal Reserve balance sheet projections
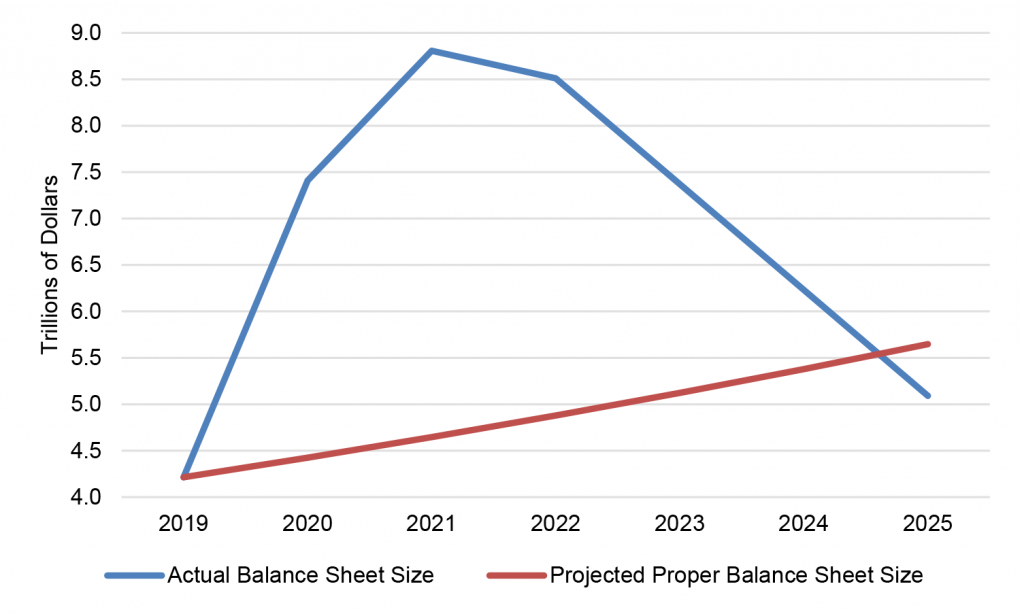
Source: Federal Reserve.
These calculations are broadly consistent with Chair Powell’s indication at the July FOMC press conference that Fed models suggest that it will take 2 to 2.5 years of balance sheet reduction at the announced pace to get the size of the balance sheet to the Fed’s desired level. His estimate would suggest an end to balance sheet reduction somewhere in the neighborhood of late 2024 or early 2025.
Would the Fed stop early?
In light of these numbers, halting balance sheet reduction requires a series of assumptions, each of which can be questioned.
First, there is the matter of when the Fed will ease again. As I have noted extensively, I expect the FOMC to hike rates for longer and to a significantly higher level than the market is currently pricing. In my view, the rate hike cycle may end around mid-2023. Moreover, I do not expect a quick turnaround to easing. In my view, inflation is likely to remain stubbornly high well after the Fed stops raising rates. Several Fed officials in recent weeks have emphasized that the FOMC is unlikely to cut rates in 2023, in what could be described as a pointed effort to challenge market expectations.
Presumably, an early end to balance sheet reduction is out of the question unless or until easing is warranted.
Beyond this relatively straightforward consideration, there is also a question about the relationship between rate policy and balance sheet strategy. In my view, the 2019 episode offers only limited insight to this issue. It was an odd coincidence that the Fed balance sheet neared the proper size at just the time that the FOMC elected to trim rates. The Fed had already decided to halt balance sheet reduction at the end of September 2019, well before it voted to lower the funds rate target in July and cut short balance sheet runoff by two months.
Generally, Fed officials have talked about not wanting the two elements of Fed policy, rates and the balance sheet, to be moving in opposite directions. However, that discussion has always taken place in the context of moving from easing policy to tightening. While it is undoubtedly true that in an ideal world, the Fed would like its two policy tools to always be pointed in the same direction, this logic may or may not hold in the 2023-2025 period for two reasons.
First, when the Fed pivots to cutting rates, the first steps will probably be described by the FOMC as shifting to a less restrictive stance, not necessarily as an “easing” in the classic sense. The higher rates eventually go, the more clear this approach will be. Let’s assume hypothetically that the FOMC is forced to hike rates to around 4.5% to get inflation under control, roughly my forecast. Given an assessment that the long-run neutral stance may be somewhere in the 2.5% to 3% range, when inflation does finally retreat to target, the Fed would likely want to lower its policy rate even if the economy were growing at a healthy clip.
In this example, there would be no compelling imperative for the Fed to halt its balance sheet normalization campaign early, even as it was lowering rates since policy would merely be moving from very restrictive to less restrictive. Of course, there are alternative scenarios where the economy is collapsing, and policy needs to quickly move into easing mode. That might lead to a different Fed response on the balance sheet, but the broader point is that there need not be a mechanical link of Fed rates and the end of balance sheet normalization.
Second, the balance sheet strategy likely hinges to a degree on the outlook for monetary policy. Deciding to stop balance sheet reduction at a level that is still obviously far higher than the “proper” level presumes that there is a strong possibility that the next easing cycle will end up at the zero bound again and require yet another round of QE. If the Fed had 100% confidence that the zero bound would not be hit again in the foreseeable future, then there would be no compelling reason to maintain a bloated balance sheet. There is a cost to maintaining a balance sheet that is larger than needed, as it requires the Fed to go through all sorts of gymnastics, such as draining massive amounts of excess liquidity through its overnight RRP facility. Of course, the Fed can never be 100% confident about anything, but if the funds rate reaches 4% or higher at the peak in 2023, there would be plenty of cushion before a swing to balance sheet expansion would realistically come into play again.
No one knows exactly how the Fed would respond to these hypothetical scenarios. I doubt Fed officials themselves know, and, if they have debated it, there has certainly been no public guidance on the subject. I do not have a high degree of confidence about how balance sheet strategy will evolve, but I believe it is risky to simply assume that the Fed will freeze the size of the balance sheet, no matter how large it is, the minute it stops tightening or begins to ease. A plausible case can be made for the FOMC to plow ahead and finish the job, possibly even as it is cutting rates.