


By the Numbers
CMO issuance and the yield curve and dollar roll myth
Brian Landy, CFA | August 12, 2022
This document is intended for institutional investors and is not subject to all of the independence and disclosure standards applicable to debt research reports prepared for retail investors. This material does not constitute research.
Absolute agency CMO production in July dropped to one of its lowest levels in years, likely stirring up conversation in some parts of the market about the impact of the flatter yield curve and the implications for TBA dollar rolls. But conventional wisdom that a flatter curve hurts CMO production and, in turn, softens the TBA dollar rolls does not hold up on close inspection. It is a case of correlation but not causality. CMO production as a share of newly issued MBS pools has run relatively steady for years through steep and flat curves. And that tells a very different story about what to expect in CMOs and dollar rolls ahead.
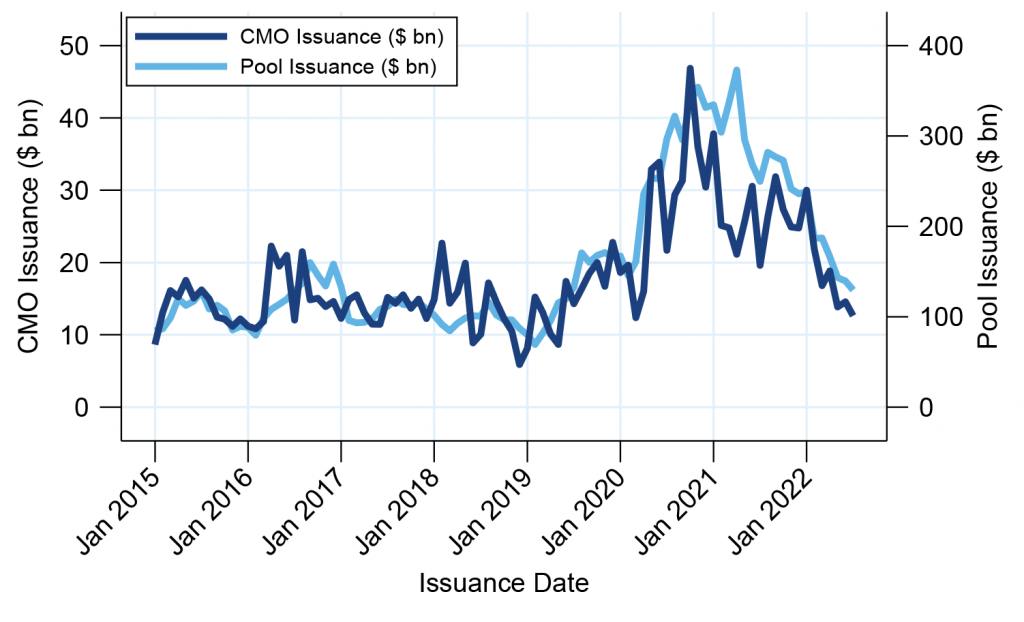
As MBS pool production goes, so goes CMO issuance
CMO production in July fell 13.3% month-over-month and is 57.9% below January’s volume. But this year, as it has for years, issuance of new CMOs has closely tracked the gross issuance of new agency MBS. In the five years before to the pandemic, for example, both pool and CMO supply ran at roughly steady levels (Exhibit 1). CMO production bounces around more than pool production since structuring desks can accumulate pools over more than one monthly issuance cycle before creating a deal, but otherwise both series were relatively range-bound during those years. When refinancing picked up in the second half of 2019, so did CMO production. And when refinancing boomed during the pandemic, so did CMO production. Both pool and CMO issuance have been falling since early 2021, and the slowdown has continued as interest rates have headed higher this year.
Exhibit 1: CMO issuance closely tracks pool supply
Source: Fannie Mae, Freddie Mac, Ginnie Mae, Amherst Pierpont Securities
Calculating the percentage of new pool supply that is locked into CMOs each month makes the trend even clearer. For much of the last seven years, including during the pandemic, CMO desks absorbed 10% to 15% of monthly pool supply. Those percentages held through periods of greater and lower absolute CMO activity. For example, CMO issuance share jumped to around 17% for a few months in early 2018 and dropped below 10% for a few months in 2021. The red line is a simple regression to show that there has been a long-term downward trend.
Exhibit 2: CMO issuance is a relatively constant share of pool supply

Note: The light-blue line is the actual percentage each month. The dark-blue line filters out monthly noise and a small amount of annual seasonality The smoothed line was created using a Butterworth filter. The trend line is a simple linear regression.
Source: Fannie Mae, Freddie Mac, Ginnie Mae, Intex, Amherst Pierpont Securities
The explanation for the pattern of absolute and percentage CMO issuance is straightforward: investors that own CMOs routinely replace them as they pay down. When interest rates fall and prepayment speeds increase, investors need to replace prepaid CMO balances with new ones. Pool issuance increases at the same time as newly refinanced loans get re-pooled. A CMO investor could potentially decide to replace the CMO investment with pass-throughs, non-agency MBS, CMBS, or some other asset class. But the data suggest investors routinely reinvest in CMOs presumably because the cash flow profile, credit, liquidity or some other attribute of CMOs is well suited to their portfolio. In other words, a roughly steady proportion of MBS investors use CMO structure to tailor cash flows to their portfolio needs.
The myth of CMO production and the yield curve
These results challenge the conventional wisdom that CMO production depends on a steep yield curve to allow CMO structuring desks to sell short cash flows at high prices. If a steep curve raised CMO demand or improved profits from structuring, then CMO share of new pools would rise in a steep curve and fall in a flat one. But that clearly is not the case, at least over the last seven years when the curve has been both steep and flat at different times and CMO share has nevertheless been steady (Exhibit 3).
Exhibit 3: CMO share of pool issuance bears little resemblance to curve slope

Source: Fannie Mae, Freddie Mac, Ginnie Mae, Amherst Pierpont Securities
It is easy to see where a casual observer would draw a link between the curve and CMOs. Yield curve slope is clearly aligned with prepayments and absolute CMO production volume (Exhibit 4). That alignment likely comes from the tendency of the yield curve to steepen as rates fall, most often as the market anticipates Fed easing into a slower economy. The observer sees a steeper curve and higher CMO production. But the steeper curve is likely a sideshow to lower rates, higher prepayments and the need for CMO investors to replace prepaid balances. If rates ever dropped with the yield curve flatter, CMO production presumably would also rise.
Exhibit 4: Absolute CMO production is roughly aligned with yield curve shape

Source: Fannie Mae, Freddie Mac, Ginnie Mae, Amherst Pierpont Securities
A thought on dollar rolls
CMOs clearly play an important role the dynamics of the TBA dollar roll. Since CMOs buy pools and take delivery, they lower the floating supply of pools available to cover TBA sales. To draw out pools from current MBS holders and replenish supply, trading desks that have made TBA sales need to offer a higher dollar roll drop. Some investors might assume higher CMO production goes hand-in-hand with a higher dollar rolls and more aggressive financing for MBS. That may be true in certain periods where CMOs buy an extraordinarily high or low share of new production. But the historically relatively steady CMO share of new pools suggests CMOs exert a steady influence on dollar rolls whether absolute CMO production is high or low. It is CMO share, not absolute production, that makes the key difference in dollar rolls.
Some important twists in the latest CMO numbers
CMO production and pool production fell in July. However, Ginnie Mae CMO issuance increased. This is partially explained by difference in pool production across the agencies—Ginnie pool issuance was flat, while conventional issuance dropped. But heavy Ginnie CMO issuance also likely reflects shifting bank demand. Banks have preferred Ginnie Mae securities for much of the year since they receive better capital treatment. That is helpful for banks facing unrealized losses on MBS positions because of higher interest rates. Heavier buying of Ginnie pools for CMOs could keep Ginnie rolls strong while conventional rolls weaken.