


By the Numbers
Plunge in home affordability lifts demand for single-family rentals
Mary Beth Fisher, PhD | August 5, 2022
This document is intended for institutional investors and is not subject to all of the independence and disclosure standards applicable to debt research reports prepared for retail investors. This material does not constitute research.
Higher home prices and rising interest rates have pushed the average mortgage principal and interest payment for the median priced home from $1,000 to $1,800 a month. American Homes 4 Rent, the largest single-family rental operator in the US, has an average rent of $1,850 per month. Renting a single-family home for now is considerably cheaper than owning one, particularly in high-cost metro areas. Home price appreciation and rent growth are both showing signs of moderation. The longer term outlook favors single-family rentals as the existing home supply shortage will take years to resolve, and affordability will probably favor renting.
Dissecting the factors driving home affordability
Median family incomes jumped sharply several times during the pandemic due to fiscal stimulus payments in the various Covid relief bills. Much of the stimulus payments went into savings, often used to make down payments on homes. Wage increases also accelerated gains in median family incomes, which are up 9.3% compared to pre-Covid levels.
Exhibit 1: Home price appreciation has outpaced the rise in incomes
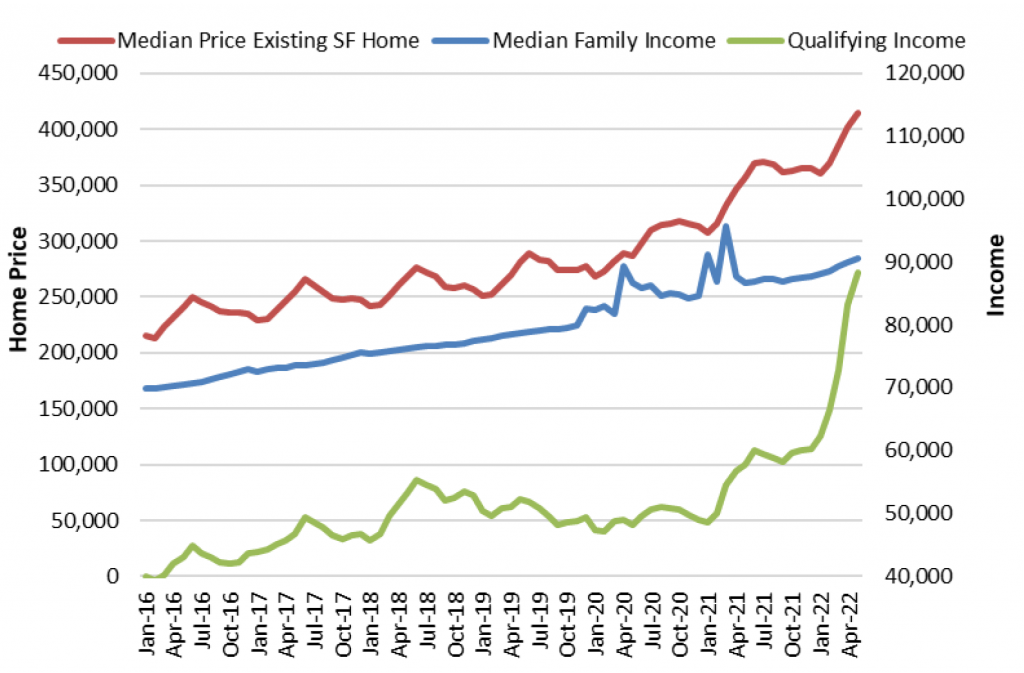
Note: Mortgage interest rates are the effective rate on loans closed on existing homes, which includes the amortization of initial fees and charges. The qualifying income is the estimated minimum income necessary to qualify for a loan on a median priced home, assuming the monthly principal and interest payment does not exceed 25% of monthly income (Qualifying Income = P & I payment * 12 * 4). Data as of May 2022.
Source: NAR, U.S. Census Bureau, Federal Housing Finance Board, Bloomberg, Amherst Pierpont Santander
The gains in median family income are dwarfed by the rise in median home prices, which are up 51.8% from pre-pandemic levels from $272,800 in February of 2020 to $414,200 as of May 2022. One result of rising home prices combined with rapidly rising mortgage rates is that the median family income of $90,600 is now just barely above the qualifying income of $88,400, which is the minimum income necessary to afford a median priced home. This has pushed home affordability way down (Exhibit 2).
Exhibit 2: Home affordability has plunged as home prices and mortgage rates have risen

Note: The NAR housing affordability index measures whether or not a typical family could qualify for a mortgage loan on a typical home. To interpret the indices, a value of 100 means that a family with the median income has exactly enough income to qualify for a mortgage on a median-priced home. An index above 100 signifies that family earning the median income has more than enough income to qualify for a mortgage loan on a median-priced home, assuming a 20 percent down payment. For example, a composite HAI of 120.0 means a family earning the median family income has 120% of the income necessary to qualify for a conventional loan covering 80 percent of a median-priced existing single-family home. An increase in the HAI, then, shows that this family is more able to afford the median priced home.
Source: NAR, Bloomberg, Amherst Pierpont Santander
Many people and organizations quibble with NAR’s calculation of home affordability. In the years immediately prior to the pandemic, the index ranged from 140 to 180, implying the average family had 140% to 180% of the income necessary to afford the principal and interest payment on the median priced home.
There are other important factors that impact costs and borrowing limits that aren’t included in most home affordability indices, primarily because they can vary substantially by location and across borrowers. Some of these are:
- Property taxes and mortgage insurance, which are included in monthly mortgage payments
- Maintenance fees and homeowners association dues
- Family debt burden, since debt-to-income ratio typically influences the maximum mortgage loan a borrower can take out
Regardless of the construction of the home affordability index, all of them have dropped sharply in recent months, primarily due to the rise in mortgage interest rates. Affordability varies substantially with mortgage rates, which helps explain why home prices tend to rise when mortgage rates fall, and can stagnate or decline when rates rise. In the months prior to the pandemic:
- The median home price was $275,000 (Exhibit 3, yellow dot)
- Effective mortgage rates were 3.50%
- Making the median mortgage P&I payment about $1,000 per month
- Median family income was $84,000 (Exhibit 3, yellow dot).
The NAR affordability index was about 175, meaning in theory the family had 175% more income than necessary to qualify for the loan. The minimum qualifying income would be $1000 * 12 * 4 = $48,000. Let’s assume that the median family wants or needs to sustain this buffer, and only spends 15% as opposed to 25% of its monthly income on the principal and interest portion of the mortgage payment (this makes the multiplier in the formula above 7 as opposed to 4). Assuming a fixed $1000 monthly payment and a 20% down payment, Exhibit 3 shows what priced home the median family can afford for various interest rates.
Exhibit 3: Home prices that correspond to a $1000 mortgage payment

Note: Mortgage payment fixed at $1,000 per month, principal and interest only. Home prices assume a 20% down payment.
Source: NAR, Amherst Pierpont Santander
For every 25 bp decline (increase) in mortgage rates from 3.50%, a home buyer can afford a house that is 3% more (less) expensive for the same $1,000 payment. The median home price of $275,000 at 3.50% can rise over 13% to $315,000 when rates drop to 2.50% for the same payment. On the flip side, a 100 bp rise in mortgage rates from 3.50% to 4.50% drops the median priced home from $275,000 to about $250,000 for the same $1,000 payment.
Declining home affordability should increase demand for rentals
There is some evidence that as home prices and/or mortgage rates rise, borrowers are willing to stretch to buy homes (Exhibit 4). The median mortgage P&I payment stayed right about $1,000 per month throughout 2020 despite the decline in mortgage rates and rising house prices. The payment as a percentage of income actually declined from 16% to 14%, probably due to the stimulus payments. That shifted in 2021 as home prices rapidly rose. The rise in mortgage rates in the first half of 2022 pushed the median P&I payment up to $1,800 per month, which is 24% of median monthly income.
Exhibit 4: Average monthly payments have risen as a % of income

Note: Data as of May 2022.
Source: NAR, Bloomberg, Amherst Pierpont Santander
This shift has fundamentally tipped the balance in favor of renting as opposed to owning a single-family home (Exhibit 5).
Exhibit 5: Renting a single-family home is cheaper than owning

Source: American Homes 4 Rent, investor presentation, June 2022. John Burns Real Estate Consulting, LLC. U.S. Census
American Homes 4 Rent, the largest single-family rental (SFR) operator in the U.S., has an average rent of just over $1,850 per month, about the same as the principal and interest payment on the median priced home. Renters don’t have the additional maintenance, property taxes, mortgage insurance and other expenses that accrue to homeowners.
The decline in affordability should eventually put some downward pressure on home price appreciation. But the severe supply shortage is years from being materially solved and millennials are approaching peak homeownership, or single-family rental years. The fundamental outlook for SFR has improved as affordability has shifted to renting as opposed to owning.