The Long and Short
Good results, a focus on cutting debt at CVS
This material is a Marketing Communication and does not constitute Independent Investment Research.
CVS posted better-than-expected second quarter results with double-digit top line growth in both its pharmacy services and health care benefits businesses. The rise of new Covid variants has led to increased testing, including OTC tests, and an uptick in vaccinations, both running higher than the company previously forecasted. The strong performance allowed the company to increase full-year guidance once again. The long end of the CVS curve looks like the best relative value.
Management has remained focused on bringing leverage to its low 3.0x target, with continued debt reduction. Leverage is now within the company’s target range and while CVS should continue looking for M&A opportunities, if none materialize, management should continue to direct a portion of free cash flow to reduce debt further.
While the best peer comp for CVS is Walgreens Boots Alliance Inc. (WBA – Baa2 (n)/BBB), it makes sense to track CVS relative to The Kroger Company (KR – Baa1/BBB), too. While spreads have widened and curves have flattened over the past year, CVS’ curve has historically been trading through KR’s curve. The back end of KR’s curve has tightened, and now trades through CVS. For those who can add duration, the best relative value is in CVS long-dated bonds (Exhibit 1).
Exhibit 1. CVS vs. KR Yield Curves
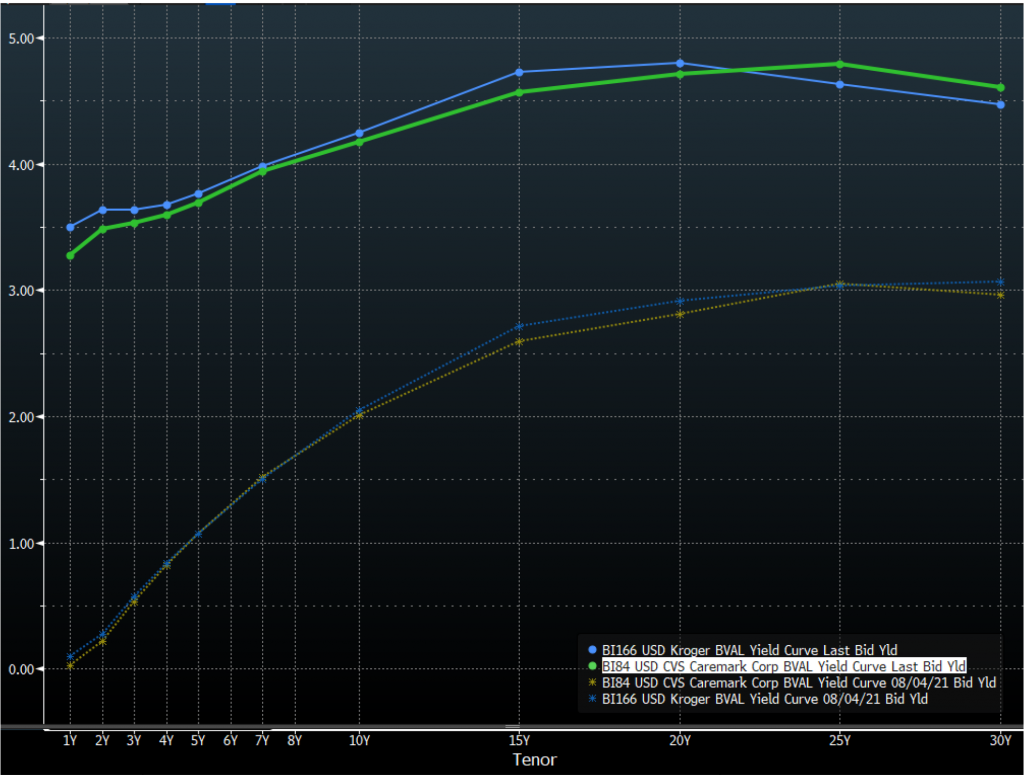
Source: Bloomberg TRACE; APS
Double-Digit Top Line Growth
CVS posted consolidated revenue growth of 11% in the quarter which reflected growth across all business lines. The Pharmacy Services unit (CVS’ largest business line), witnessed strong top line growth of 11.7%, reflecting increased pharmacy claims volume (up 3.9%), brand inflation and growth in specialty pharmacy. Specialty pharmacy saw very strong revenue growth of 21%, largely due to new business wins. The Health Care Benefits segment also witnessed double-digit top line growth of 10.9%, driven by growth across all product lines. Medical membership was up 3.8% to 24.4 million, with the biggest increase witnessed in the Government line (up 8.8% to 7.4 million). Importantly, the Medical Benefit Ratio expanded 120 bp to 82.9%, reflecting medical cost trends the remain modestly favorable versus management’s pricing assumptions. Commercial medical cost trends are now in line with pre-pandemic levels while government cost trends are just slightly below pre-pandemic levels. The Retail/LTC unit saw 6.3% revenue growth due to increased prescription and front store volumes, which have included the sale of OTC Covid test kits.
Full-Year Guidance Raised Again
Given the strong performance, management raised full-year guidance once again for revenues, adjusted operating income and adjusted EPS. Additionally, management raised guidance for cash flow from operations this quarter. Total revenues are now expected to be in the $307 to $312 billion range, translating to growth of 5%-7%. This is up from original guidance of 4%-6% growth, and up from the 5%-6% growth forecasted last quarter. Adjusted operating income is now being guided to the $17.3 to $17.6 billion range, or flat to up 2% year-over-year. At year end, CVS had expected adjusted operating income to be down in the 1%-4% range. Last quarter it had revised that guidance to be flat to down 2%. Adjusted EPS is now expected to be in the $8.40-$8.60 range which is $0.20 higher than guidance provided last quarter and $0.30 higher than guidance issued at year-end. Cash flow from operations will now be in the $12.5 to $13.5 billion range, up $500 million from previous forecasts. Management kept capital expenditures unchanged which bodes well for the free cash flow line.
Exhibit 2. CVS Updated Guidance
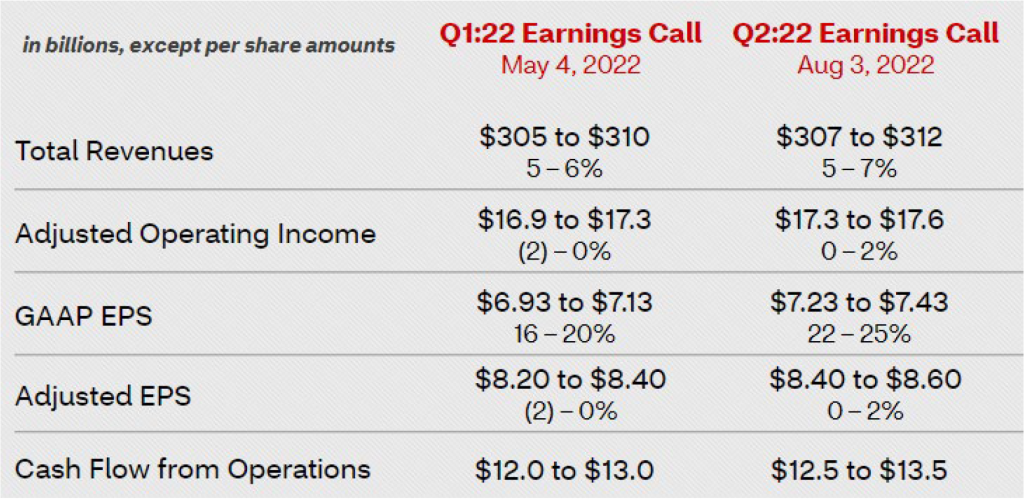
Source: Company Presentation; APS
Debt Reduction Continues – Liquidity Strong
CVS paid down $1.5 billion of long-term debt in the quarter, bringing its total net debt reduction since the close of the Aetna (AET) acquisition to $22.5 billion. We estimate that lease-adjusted leverage at the end of the second quarter stood at 3.2x. Subsequent to quarter-end, CVS redeemed AET’s 2.75% notes due 11/15/22 ($1.0 billion) and announced shortly before its earnings release that it will be redeeming both the 2.75% and 4.75% notes that are set to mature on 12/1/22, for an additional pay down of $1.65 billion. Based on the additional debt reduction, leverage should drop roughly another tick to 3.1x.
CVS ended the quarter with just under $15 billion of cash and equivalents, which means that post the additional debt reduction, its cash position remains a very strong $12.35 billion. CVS also maintains three separate revolvers that are each $2 billion in size and remain untapped, adding $6 billion of extra liquidity. CVS only has one bond maturing in 2023, $1.25 billion due on 12/5/23, putting them in a very favorable position to not have to tap the debt market should interest rates continue to rise.
This material is intended only for institutional investors and does not carry all of the independence and disclosure standards of retail debt research reports. In the preparation of this material, the author may have consulted or otherwise discussed the matters referenced herein with one or more of SCM’s trading desks, any of which may have accumulated or otherwise taken a position, long or short, in any of the financial instruments discussed in or related to this material. Further, SCM may act as a market maker or principal dealer and may have proprietary interests that differ or conflict with the recipient hereof, in connection with any financial instrument discussed in or related to this material.
This message, including any attachments or links contained herein, is subject to important disclaimers, conditions, and disclosures regarding Electronic Communications, which you can find at https://portfolio-strategy.apsec.com/sancap-disclaimers-and-disclosures.
Important Disclaimers
Copyright © 2026 Santander US Capital Markets LLC and its affiliates (“SCM”). All rights reserved. SCM is a member of FINRA and SIPC. This material is intended for limited distribution to institutions only and is not publicly available. Any unauthorized use or disclosure is prohibited.
In making this material available, SCM (i) is not providing any advice to the recipient, including, without limitation, any advice as to investment, legal, accounting, tax and financial matters, (ii) is not acting as an advisor or fiduciary in respect of the recipient, (iii) is not making any predictions or projections and (iv) intends that any recipient to which SCM has provided this material is an “institutional investor” (as defined under applicable law and regulation, including FINRA Rule 4512 and that this material will not be disseminated, in whole or part, to any third party by the recipient.
The author of this material is an economist, desk strategist or trader. In the preparation of this material, the author may have consulted or otherwise discussed the matters referenced herein with one or more of SCM’s trading desks, any of which may have accumulated or otherwise taken a position, long or short, in any of the financial instruments discussed in or related to this material. Further, SCM or any of its affiliates may act as a market maker or principal dealer and may have proprietary interests that differ or conflict with the recipient hereof, in connection with any financial instrument discussed in or related to this material.
This material (i) has been prepared for information purposes only and does not constitute a solicitation or an offer to buy or sell any securities, related investments or other financial instruments, (ii) is neither research, a “research report” as commonly understood under the securities laws and regulations promulgated thereunder nor the product of a research department, (iii) or parts thereof may have been obtained from various sources, the reliability of which has not been verified and cannot be guaranteed by SCM, (iv) should not be reproduced or disclosed to any other person, without SCM’s prior consent and (v) is not intended for distribution in any jurisdiction in which its distribution would be prohibited.
In connection with this material, SCM (i) makes no representation or warranties as to the appropriateness or reliance for use in any transaction or as to the permissibility or legality of any financial instrument in any jurisdiction, (ii) believes the information in this material to be reliable, has not independently verified such information and makes no representation, express or implied, with regard to the accuracy or completeness of such information, (iii) accepts no responsibility or liability as to any reliance placed, or investment decision made, on the basis of such information by the recipient and (iv) does not undertake, and disclaims any duty to undertake, to update or to revise the information contained in this material.
Unless otherwise stated, the views, opinions, forecasts, valuations, or estimates contained in this material are those solely of the author, as of the date of publication of this material, and are subject to change without notice. The recipient of this material should make an independent evaluation of this information and make such other investigations as the recipient considers necessary (including obtaining independent financial advice), before transacting in any financial market or instrument discussed in or related to this material.
Important disclaimers for clients in the EU and UK
This publication has been prepared by Trading Desk Strategists within the Sales and Trading functions of Santander US Capital Markets LLC (“SanCap”), the US registered broker-dealer of Santander Corporate & Investment Banking. This communication is distributed in the EEA by Banco Santander S.A., a credit institution registered in Spain and authorised and regulated by the Bank of Spain and the CNMV. Any EEA recipient of this communication that would like to affect any transaction in any security or issuer discussed herein should do so with Banco Santander S.A. or any of its affiliates (together “Santander”). This communication has been distributed in the UK by Banco Santander, S.A.’s London branch, authorised by the Bank of Spain and subject to regulatory oversight on certain matters by the Financial Conduct Authority (FCA) and the Prudential Regulation Authority (PRA).
The publication is intended for exclusive use for Professional Clients and Eligible Counterparties as defined by MiFID II and is not intended for use by retail customers or for any persons or entities in any jurisdictions or country where such distribution or use would be contrary to local law or regulation.
This material is not a product of Santander´s Research Team and does not constitute independent investment research. This is a marketing communication and may contain ¨investment recommendations¨ as defined by the Market Abuse Regulation 596/2014 ("MAR"). This publication has not been prepared in accordance with legal requirements designed to promote the independence of research and is not subject to any prohibition on dealing ahead of the dissemination of investment research. The author, date and time of the production of this publication are as indicated herein.
This publication does not constitute investment advice and may not be relied upon to form an investment decision, nor should it be construed as any offer to sell or issue or invitation to purchase, acquire or subscribe for any instruments referred herein. The publication has been prepared in good faith and based on information Santander considers reliable as of the date of publication, but Santander does not guarantee or represent, express or implied, that such information is accurate or complete. All estimates, forecasts and opinions are current as at the date of this publication and are subject to change without notice. Unless otherwise indicated, Santander does not intend to update this publication. The views and commentary in this publication may not be objective or independent of the interests of the Trading and Sales functions of Santander, who may be active participants in the markets, investments or strategies referred to herein and/or may receive compensation from investment banking and non-investment banking services from entities mentioned herein. Santander may trade as principal, make a market or hold positions in instruments (or related derivatives) and/or hold financial interest in entities discussed herein. Santander may provide market commentary or trading strategies to other clients or engage in transactions which may differ from views expressed herein. Santander may have acted upon the contents of this publication prior to you having received it.
This publication is intended for the exclusive use of the recipient and must not be reproduced, redistributed or transmitted, in whole or in part, without Santander’s consent. The recipient agrees to keep confidential at all times information contained herein.


