The Long and Short
Finding index-eligible community bank paper
This material is a Marketing Communication and does not constitute Independent Investment Research.
Most bonds outstanding from investment grade community banks come with a 10-year maturity and 5-year non-call period, and the vast majority fall below the $300 million face amount needed to qualify for a market index. The 2032 notes issued by Home BancShares earlier this year include the 5-year call typical of these deals but have an index-eligible size of $300 million. This looks like a unique opportunity to pick up exposure to community banks with liquidity, and HOMB is solid bank credit with robust capital and stable funding.
Most community bank deals have a minimum of $50 million outstanding but are not index eligible while large regional bank deals are almost all index-eligible.
Exhibit 1:10NC5 community bank notes and large regional bank bullets
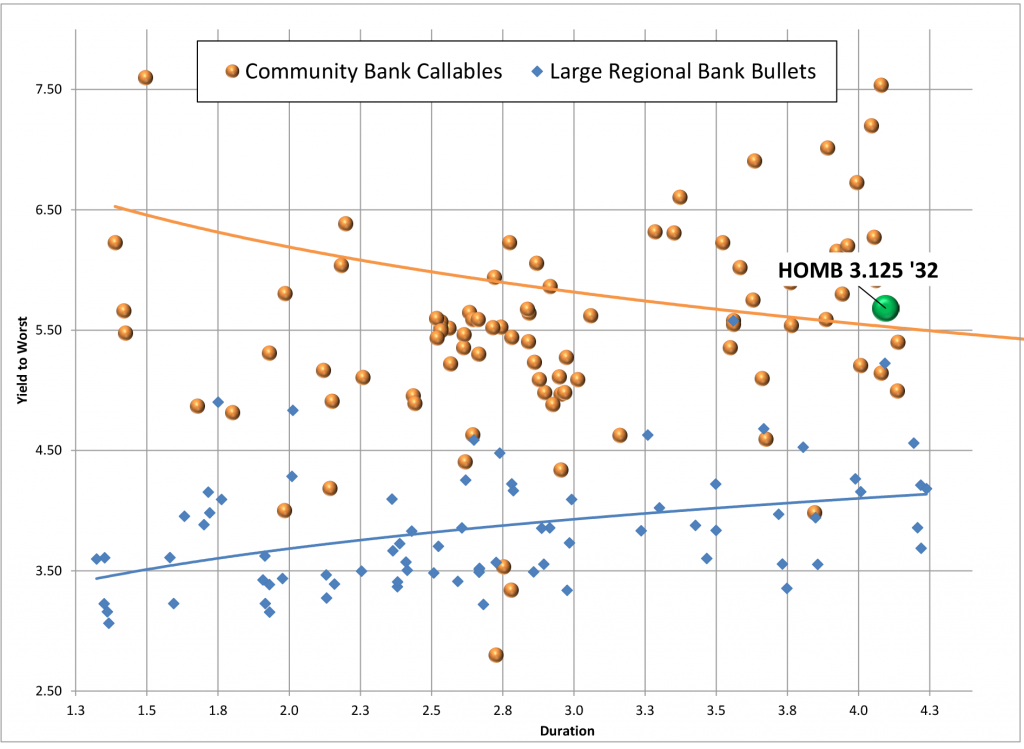
Source: Amherst Pierpont, Bloomberg/TRACE Indications
HOMB 3.125% 1/30/32-27
Pricing: $90.00, YTC 5.68%, 296/5-year Treasury
Issuer: Home BancShares Inc. (Hold of Centennial Bank.)
CUSIP: 436893AC5
Amout Outstanding: $300 million (index-eligible)
Senior Rating: Kroll – BBB+/Stable
Subordinated HoldCo Issue rating: Kroll – BBB/Stable
Callable at par 1/30/27
Coupon: 3.125% to 1/30/27; TSFR3M +182 after call date
Home BancShares Inc. is the holding company of the bank operating company Centennial Bank. Headquartered in Arkansas, HOMB provides commercial and retail banking throughout its home state and all along the Florida panhandle to the Florida Keys. The bank has 229 locations following a string of mergers throughout the past decade. The bank currently has just under $18.6 billion in total assets, $14.5 billion in deposits, and $10.1 billion in total loans. Some of the more notable, recent acquisitions include last year’s purchase of Happy Bancshares, the 2018 purchase of Shore Premier Finance, which added niche consumer lending lines, and the 2017 purchase of Stonegate Bank, which added $3 billion in total assets. HOMB has doubled in size since 2017, as it continued its expansion into Florida. The bank stood at just $2 billion in total assets at the beginning of 2007.
HOMB’s lending profile is weighted toward commercial loans with 38% of total loans in commercial real estate (CRE), 18.5% in construction and development and 15% in commercial and industrial (C&I) loans. Within CRE lending, owner-occupied properties are outnumbered by non-owner occupied, which typically carry higher risk. The remainder of loans is in residential at 12% and consumer at 11%. As demonstrated by their strategy over the past decade, HOMB management is very comfortable targeting and adding depreciated loans, most notably taking advantage of depressed market values in Florida in the years following the Great Financial Crisis. They have added both individual loan portfolios as well as entire community banks where they found compelling value.
HOMB maintains robust capital ratios. The Tier 1 Common (CET1) ratio stood at 14.87% as of the first quarter of this year, with a total risk-based capital of 21.58%.
The bank has made significant improvements to establish a more stable funding profile. Deposits are now enough to fully fund the loan book with a current loan/deposit ratio of approximately 69% at the holding company, down from more than 100% back in 2018. The use of brokered deposits is just over 4%, which has been reduced from nearly 10% several years ago through the addition of core-deposit-rich acquisitions. Reliance on wholesale funding overall is down to less than 12% from over 20% as recently as 2018. The use of shorter-term money markets and time deposits has also been reduced to negligible levels from over 18% in 2018, and over 40% before the bank began the bigger phase of its expansion.
For a bank that targets assets with depreciated values, they maintain very low levels of classified loans (since marks on loans are usually taken aggressively at time of an acquisition closes). Non-performing assets (NPA) are at a negligible level of 0.28% of total assets as of March. The bank has booked enough reserves to cover over 450% of those loans classified as non-performing. The Texas Ratio—which measures NPAs and 90-day past-due loans as a percentage of all reserves as well as equity—is less than 3%. For banks of this size/stature we consider any reading below 20% as typically manageable.
HOMB generates highly consistent return on average equity (ROAE). Returns have been mostly in the 11% to 14% range dating back to 2011, with the exception of 2017 due to heavy acquisition activity. The Bank’s Efficiency Ratio (operating expenses vs operating revenue) is extremely impressive wrapped around 40% in most years, demonstrating consistent expense management. The bank typically generates strong net interest margin (NIM) levels north of 4%, although they have been in the mid-to-high 3% range since 2021.
This material is intended only for institutional investors and does not carry all of the independence and disclosure standards of retail debt research reports. In the preparation of this material, the author may have consulted or otherwise discussed the matters referenced herein with one or more of SCM’s trading desks, any of which may have accumulated or otherwise taken a position, long or short, in any of the financial instruments discussed in or related to this material. Further, SCM may act as a market maker or principal dealer and may have proprietary interests that differ or conflict with the recipient hereof, in connection with any financial instrument discussed in or related to this material.
This message, including any attachments or links contained herein, is subject to important disclaimers, conditions, and disclosures regarding Electronic Communications, which you can find at https://portfolio-strategy.apsec.com/sancap-disclaimers-and-disclosures.
Important Disclaimers
Copyright © 2026 Santander US Capital Markets LLC and its affiliates (“SCM”). All rights reserved. SCM is a member of FINRA and SIPC. This material is intended for limited distribution to institutions only and is not publicly available. Any unauthorized use or disclosure is prohibited.
In making this material available, SCM (i) is not providing any advice to the recipient, including, without limitation, any advice as to investment, legal, accounting, tax and financial matters, (ii) is not acting as an advisor or fiduciary in respect of the recipient, (iii) is not making any predictions or projections and (iv) intends that any recipient to which SCM has provided this material is an “institutional investor” (as defined under applicable law and regulation, including FINRA Rule 4512 and that this material will not be disseminated, in whole or part, to any third party by the recipient.
The author of this material is an economist, desk strategist or trader. In the preparation of this material, the author may have consulted or otherwise discussed the matters referenced herein with one or more of SCM’s trading desks, any of which may have accumulated or otherwise taken a position, long or short, in any of the financial instruments discussed in or related to this material. Further, SCM or any of its affiliates may act as a market maker or principal dealer and may have proprietary interests that differ or conflict with the recipient hereof, in connection with any financial instrument discussed in or related to this material.
This material (i) has been prepared for information purposes only and does not constitute a solicitation or an offer to buy or sell any securities, related investments or other financial instruments, (ii) is neither research, a “research report” as commonly understood under the securities laws and regulations promulgated thereunder nor the product of a research department, (iii) or parts thereof may have been obtained from various sources, the reliability of which has not been verified and cannot be guaranteed by SCM, (iv) should not be reproduced or disclosed to any other person, without SCM’s prior consent and (v) is not intended for distribution in any jurisdiction in which its distribution would be prohibited.
In connection with this material, SCM (i) makes no representation or warranties as to the appropriateness or reliance for use in any transaction or as to the permissibility or legality of any financial instrument in any jurisdiction, (ii) believes the information in this material to be reliable, has not independently verified such information and makes no representation, express or implied, with regard to the accuracy or completeness of such information, (iii) accepts no responsibility or liability as to any reliance placed, or investment decision made, on the basis of such information by the recipient and (iv) does not undertake, and disclaims any duty to undertake, to update or to revise the information contained in this material.
Unless otherwise stated, the views, opinions, forecasts, valuations, or estimates contained in this material are those solely of the author, as of the date of publication of this material, and are subject to change without notice. The recipient of this material should make an independent evaluation of this information and make such other investigations as the recipient considers necessary (including obtaining independent financial advice), before transacting in any financial market or instrument discussed in or related to this material.
Important disclaimers for clients in the EU and UK
This publication has been prepared by Trading Desk Strategists within the Sales and Trading functions of Santander US Capital Markets LLC (“SanCap”), the US registered broker-dealer of Santander Corporate & Investment Banking. This communication is distributed in the EEA by Banco Santander S.A., a credit institution registered in Spain and authorised and regulated by the Bank of Spain and the CNMV. Any EEA recipient of this communication that would like to affect any transaction in any security or issuer discussed herein should do so with Banco Santander S.A. or any of its affiliates (together “Santander”). This communication has been distributed in the UK by Banco Santander, S.A.’s London branch, authorised by the Bank of Spain and subject to regulatory oversight on certain matters by the Financial Conduct Authority (FCA) and the Prudential Regulation Authority (PRA).
The publication is intended for exclusive use for Professional Clients and Eligible Counterparties as defined by MiFID II and is not intended for use by retail customers or for any persons or entities in any jurisdictions or country where such distribution or use would be contrary to local law or regulation.
This material is not a product of Santander´s Research Team and does not constitute independent investment research. This is a marketing communication and may contain ¨investment recommendations¨ as defined by the Market Abuse Regulation 596/2014 ("MAR"). This publication has not been prepared in accordance with legal requirements designed to promote the independence of research and is not subject to any prohibition on dealing ahead of the dissemination of investment research. The author, date and time of the production of this publication are as indicated herein.
This publication does not constitute investment advice and may not be relied upon to form an investment decision, nor should it be construed as any offer to sell or issue or invitation to purchase, acquire or subscribe for any instruments referred herein. The publication has been prepared in good faith and based on information Santander considers reliable as of the date of publication, but Santander does not guarantee or represent, express or implied, that such information is accurate or complete. All estimates, forecasts and opinions are current as at the date of this publication and are subject to change without notice. Unless otherwise indicated, Santander does not intend to update this publication. The views and commentary in this publication may not be objective or independent of the interests of the Trading and Sales functions of Santander, who may be active participants in the markets, investments or strategies referred to herein and/or may receive compensation from investment banking and non-investment banking services from entities mentioned herein. Santander may trade as principal, make a market or hold positions in instruments (or related derivatives) and/or hold financial interest in entities discussed herein. Santander may provide market commentary or trading strategies to other clients or engage in transactions which may differ from views expressed herein. Santander may have acted upon the contents of this publication prior to you having received it.
This publication is intended for the exclusive use of the recipient and must not be reproduced, redistributed or transmitted, in whole or in part, without Santander’s consent. The recipient agrees to keep confidential at all times information contained herein.


