By the Numbers
Gauging the impact of recession on commercial real estate
This material is a Marketing Communication and does not constitute Independent Investment Research.
Commercial real estate performance during recessions historically has been weak, with the time to full recovery varying from one to three years after the trough. With the Fed tightening, recession risks have gone up. CMBS delinquencies ticked higher in June after generally declining steadily from the pandemic peak of June 2020. And commercial real estate prices this year have stagnated. Both delinquencies and stagnant pricing look likely to continue.
CMBS delinquencies ticked 7 bp higher in June from 2.5% to 3.2% (Exhibit 1). Although modest, a backlog of 4.9% of loans remain in special servicing due to pandemic. The proportion of loans in special servicing is expected to rise in the coming months as maturing loans find it difficult to refinance at higher interest rates, according to the recent report from CREFC and Moody’s. Projections are that up to 3.5% of the CMBS loan universe could experience a maturity default over the next 18 months.
Exhibit 1: CMBS delinquency and special servicing
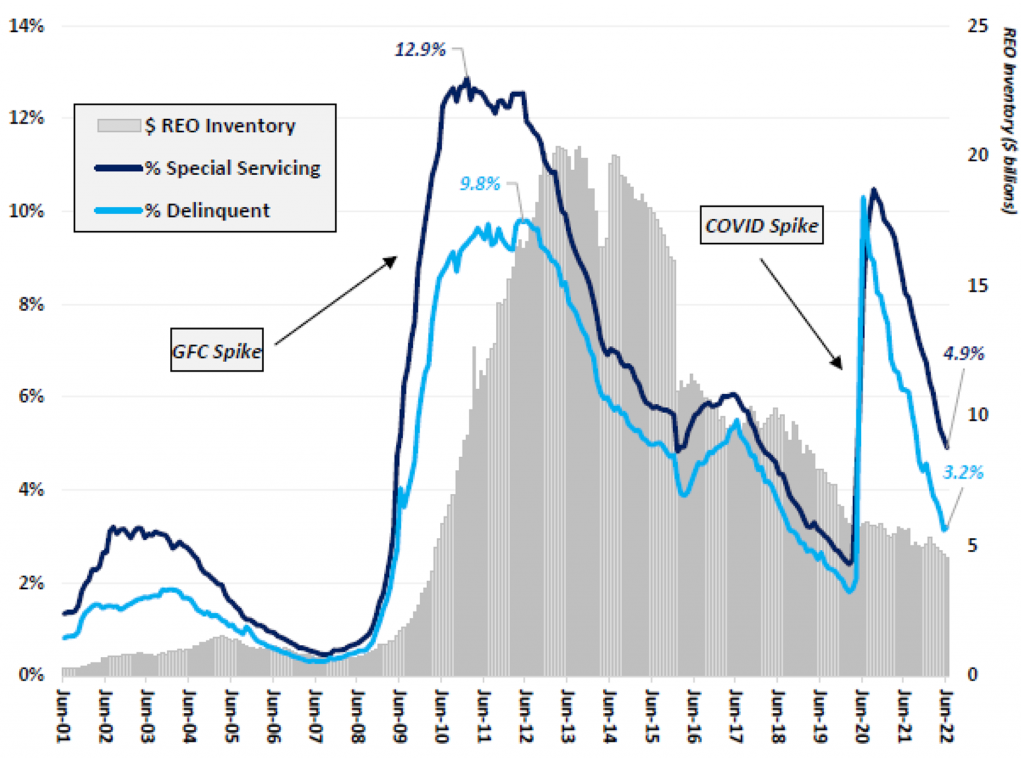
Note: Includes both conduit and SASB.
Source: CREFC, Intex, Trepp
Weakness in CMBS would probably flow from a broader downtrend in CRE performance due to a recession that has either technically already started, or is likely to emerge as the Fed continues to battle inflation.
CRE performance and prices typically weaken during a recession
The National Bureau of Economic Research (NBER) has declared recessions four times over the last 35 years:
- July 1990 – March 1991 (8 months)
- March 2001 – November 2001 (8 months)
- December 2007 – June 2009 (18 months)
- February 2020 – April 2020 (2 months, the shortest US recession on record)
The rising unemployment and negative economic growth typical of recessions impairs the performance of most asset classes, and commercial real estate (CRE) is no exception. CRE property performance tends to deteriorate as demand flags and vacancy rates rise, causing cash flows to weaken. This cascades into declining property prices, reflecting not only cash flows but rates and risk premiums.
The primary method for valuing CRE is the discounted cash flow approach (DCFA). The DCFA is similar to valuing a bond or stock or any other financial assets in that it computes the net present value of future cash flows based on a discount rate. The discount rate is the sum of a risk-free rate and an investor risk premium. During a recession both the expected future cash flows can decline, and the discount rate is likely to rise. This typically occurs because the investor risk premium increases, or the Fed hikes interest rates causing the risk-free rate to rise, or both. The result is that CRE property valuations tend to decline during and after recessions (Exhibit 2).
Exhibit 2: Composite change in CRE valuation (%)
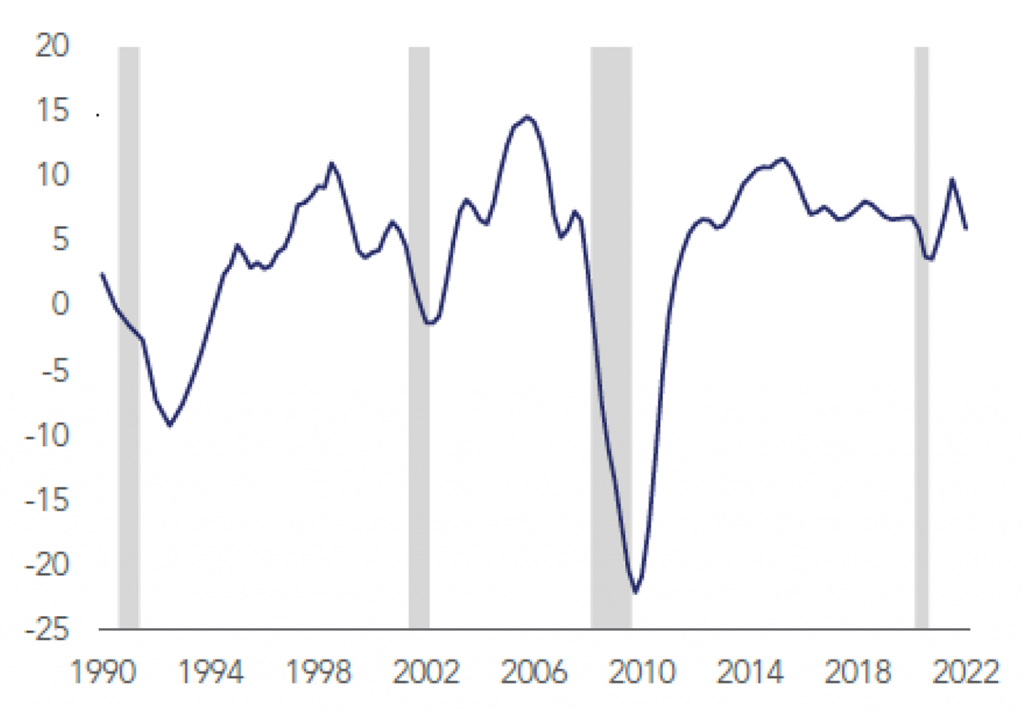
Note: Shaded areas are U.S. recessions.
Source: MSCI, Office of Financial Research
Weaker cash flows also put downward pressure on debt service coverage ratios (DSCR). The lower property valuations cause loan-to-value ratios (LTV) to rise. This is a negative for CRE investors in securitized products where credit metrics are declining and may be subject to credit rating downgrades, and for CRE lenders who can be required to hold more capital against the deteriorating loans.
Historically, CRE loan delinquencies and losses have increased during recessions, putting stress on commercial banks, life insurers and other financial institutions which had significant exposure. This caused lending to the sector to contract, financial conditions to tighten, and in isolated instances contributed to the failure of some small banks.
The 1990 recession is notable in that CRE prices continued to decline for several quarters after the end of the recession, taking 12 quarters for valuations to fully recover. There were two complicating factors that contributed to the long recovery time:
- There had been a substantial run-up in CRE prices in the late 1980s
- The 1990 recession is often referred to as the “jobless recovery”, because the unemployment rate continued to rise even through economic growth rebounded into positive territory.
The CRE weakness was particularly evident in the office sector, where the rebound in prices lagged in several major cities, creating a drag on the recovery.
A complete analysis of the performance of the commercial real estate (CRE) sector during these four recessions can be found in a recent paper, U.S. Commercial Real Estate Has Proven Resilient, but Emerging Risks Could Generate Losses for Lenders, published by the Office of Financial Research.
This material is intended only for institutional investors and does not carry all of the independence and disclosure standards of retail debt research reports. In the preparation of this material, the author may have consulted or otherwise discussed the matters referenced herein with one or more of SCM’s trading desks, any of which may have accumulated or otherwise taken a position, long or short, in any of the financial instruments discussed in or related to this material. Further, SCM may act as a market maker or principal dealer and may have proprietary interests that differ or conflict with the recipient hereof, in connection with any financial instrument discussed in or related to this material.
This message, including any attachments or links contained herein, is subject to important disclaimers, conditions, and disclosures regarding Electronic Communications, which you can find at https://portfolio-strategy.apsec.com/sancap-disclaimers-and-disclosures.
Important Disclaimers
Copyright © 2026 Santander US Capital Markets LLC and its affiliates (“SCM”). All rights reserved. SCM is a member of FINRA and SIPC. This material is intended for limited distribution to institutions only and is not publicly available. Any unauthorized use or disclosure is prohibited.
In making this material available, SCM (i) is not providing any advice to the recipient, including, without limitation, any advice as to investment, legal, accounting, tax and financial matters, (ii) is not acting as an advisor or fiduciary in respect of the recipient, (iii) is not making any predictions or projections and (iv) intends that any recipient to which SCM has provided this material is an “institutional investor” (as defined under applicable law and regulation, including FINRA Rule 4512 and that this material will not be disseminated, in whole or part, to any third party by the recipient.
The author of this material is an economist, desk strategist or trader. In the preparation of this material, the author may have consulted or otherwise discussed the matters referenced herein with one or more of SCM’s trading desks, any of which may have accumulated or otherwise taken a position, long or short, in any of the financial instruments discussed in or related to this material. Further, SCM or any of its affiliates may act as a market maker or principal dealer and may have proprietary interests that differ or conflict with the recipient hereof, in connection with any financial instrument discussed in or related to this material.
This material (i) has been prepared for information purposes only and does not constitute a solicitation or an offer to buy or sell any securities, related investments or other financial instruments, (ii) is neither research, a “research report” as commonly understood under the securities laws and regulations promulgated thereunder nor the product of a research department, (iii) or parts thereof may have been obtained from various sources, the reliability of which has not been verified and cannot be guaranteed by SCM, (iv) should not be reproduced or disclosed to any other person, without SCM’s prior consent and (v) is not intended for distribution in any jurisdiction in which its distribution would be prohibited.
In connection with this material, SCM (i) makes no representation or warranties as to the appropriateness or reliance for use in any transaction or as to the permissibility or legality of any financial instrument in any jurisdiction, (ii) believes the information in this material to be reliable, has not independently verified such information and makes no representation, express or implied, with regard to the accuracy or completeness of such information, (iii) accepts no responsibility or liability as to any reliance placed, or investment decision made, on the basis of such information by the recipient and (iv) does not undertake, and disclaims any duty to undertake, to update or to revise the information contained in this material.
Unless otherwise stated, the views, opinions, forecasts, valuations, or estimates contained in this material are those solely of the author, as of the date of publication of this material, and are subject to change without notice. The recipient of this material should make an independent evaluation of this information and make such other investigations as the recipient considers necessary (including obtaining independent financial advice), before transacting in any financial market or instrument discussed in or related to this material.
Important disclaimers for clients in the EU and UK
This publication has been prepared by Trading Desk Strategists within the Sales and Trading functions of Santander US Capital Markets LLC (“SanCap”), the US registered broker-dealer of Santander Corporate & Investment Banking. This communication is distributed in the EEA by Banco Santander S.A., a credit institution registered in Spain and authorised and regulated by the Bank of Spain and the CNMV. Any EEA recipient of this communication that would like to affect any transaction in any security or issuer discussed herein should do so with Banco Santander S.A. or any of its affiliates (together “Santander”). This communication has been distributed in the UK by Banco Santander, S.A.’s London branch, authorised by the Bank of Spain and subject to regulatory oversight on certain matters by the Financial Conduct Authority (FCA) and the Prudential Regulation Authority (PRA).
The publication is intended for exclusive use for Professional Clients and Eligible Counterparties as defined by MiFID II and is not intended for use by retail customers or for any persons or entities in any jurisdictions or country where such distribution or use would be contrary to local law or regulation.
This material is not a product of Santander´s Research Team and does not constitute independent investment research. This is a marketing communication and may contain ¨investment recommendations¨ as defined by the Market Abuse Regulation 596/2014 ("MAR"). This publication has not been prepared in accordance with legal requirements designed to promote the independence of research and is not subject to any prohibition on dealing ahead of the dissemination of investment research. The author, date and time of the production of this publication are as indicated herein.
This publication does not constitute investment advice and may not be relied upon to form an investment decision, nor should it be construed as any offer to sell or issue or invitation to purchase, acquire or subscribe for any instruments referred herein. The publication has been prepared in good faith and based on information Santander considers reliable as of the date of publication, but Santander does not guarantee or represent, express or implied, that such information is accurate or complete. All estimates, forecasts and opinions are current as at the date of this publication and are subject to change without notice. Unless otherwise indicated, Santander does not intend to update this publication. The views and commentary in this publication may not be objective or independent of the interests of the Trading and Sales functions of Santander, who may be active participants in the markets, investments or strategies referred to herein and/or may receive compensation from investment banking and non-investment banking services from entities mentioned herein. Santander may trade as principal, make a market or hold positions in instruments (or related derivatives) and/or hold financial interest in entities discussed herein. Santander may provide market commentary or trading strategies to other clients or engage in transactions which may differ from views expressed herein. Santander may have acted upon the contents of this publication prior to you having received it.
This publication is intended for the exclusive use of the recipient and must not be reproduced, redistributed or transmitted, in whole or in part, without Santander’s consent. The recipient agrees to keep confidential at all times information contained herein.


