


The Big Idea
Lessons from the school of hard knocks
Steven Abrahams | July 15, 2022
This material is a Marketing Communication and does not constitute Independent Investment Research.
Credit really took it on the chin from April through June as the Fed increasingly seemed willing to fight inflation even at the cost of recession. It is not over yet. The Fed looks determined, and credit has performed poorly before or during each US recession since the late 1980s. The last quarter of returns makes a strong case for allocating away from at least the most sensitive credit and toward stronger, more liquid assets.
A rough track record for credit before and during recession
Of the four US recessions since the late 1980s, investment grade credit underperformed a duration-matched portfolio of Treasury debt by an average of 0.25% in the six months before recession and underperformed by 8.61% during recession (Exhibit 1). High yield debt underperformed duration-matched Treasury debt by an average 4.43% in the six months before recession and by 16.19% during. Sometimes credit outperformed Treasury debt before recession but underperformed during, and sometimes the pattern flipped as the market seemed to look through immediate circumstances. In contrast, agency MBS on average broke even to duration-matched Treasury debt in the run-up to recession and outperformed by 2 bp during. Assets relatively free of credit risk and typically with much deeper liquidity outperformed.
Exhibit 1: Slowdown and recession historically has hurt credit performance
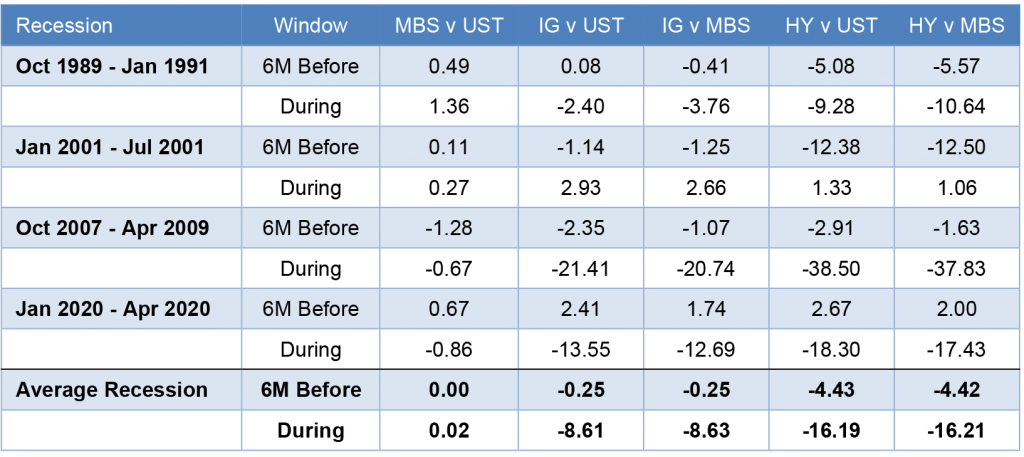
Note: data shows cumulative excess return in percent—total return net of returns on duration-matched Treasury debt—on each asset based on the corresponding Bloomberg/Barclays index. Average is a simple average of the four recessions.
Source: Bloomberg, Amherst Pierpont Securities.
Credit leads the way down ahead of possible recession,
It would be hard to find any investor that has not already considered the risk of slower growth as the Fed tightens, and that is not a good risk for credit. It showed in the first quarter. Annualized first quarter returns on high yield corporate debt (-43%), investment grade corporate debt (-31%) and leveraged loans (-19%) set the low marks for fixed income (Exhibit 2). And high yield and investment grade debt delivered their returns with the highest volatility among fixed income asset classes. That left leveraged loans as the best—or at least, based on return for each unit of risk, the most efficient—of the worst performers.
Exhibit 2: Corporate credit led the way lower in 2Q22
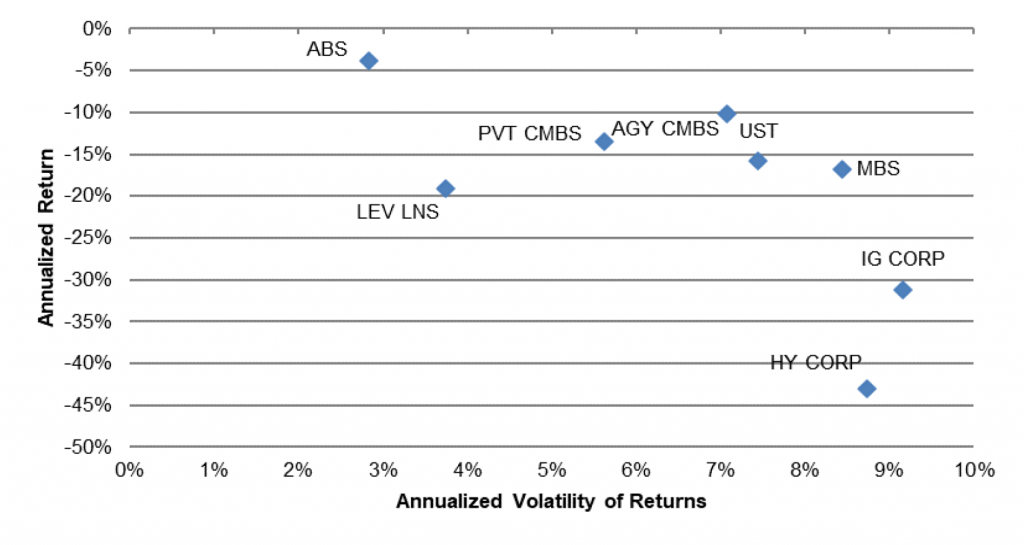
Note: Annualized daily returns and volatility based on Bloomberg/Barclays indices in each asset class except leveraged loans, which is based on the S&P/LSTA Total Return Index.
Source: Bloomberg, S&P, Amherst Pierpont Securities
Sectors largely protected from credit risk clustered in a tier above corporate credit. Annualized quarterly returns on MBS (-17%), Treasury debt (-16%) and agency CMBS (-10%) made up the next performance tier along with private CMBS (-13%). The private CMBS benchmark is largely ‘AAA’ or ‘AA’ and much more insulated from credit risk than even the investment grade corporate index, where more than half of holdings are ‘BBB’. The best returns, considering both level and volatility, came from ABS (-4%), where the index also is largely ‘AAA’ or ‘AA’.
Spreads, not rates alone, did clear damage to credit
Spreads, where the market reprices the non-rate risks in an asset class, did as much or more damage to credit in the second quarter as did rates. Of the annualized 43% loss in high yield, for example, 30% came from wider spreads and 13% from higher interest rates (Exhibit 3). Since leveraged loan coupons reset off a floating market index and consequently have no price sensitivity to changing rates, the entire annualized 20% loss in loans came from wider spreads. In the 31% annualized loss in investment grade debt, a relatively modest 8% came from spreads. Other sectors took much smaller hits from wider spreads, and agency CMBS even saw spreads tighten from beginning to end of the quarter—the tighter agency CMBS spreads largely due to very low supply.
Exhibit 3: Wider credit spreads did more damage than higher rates in 2Q22
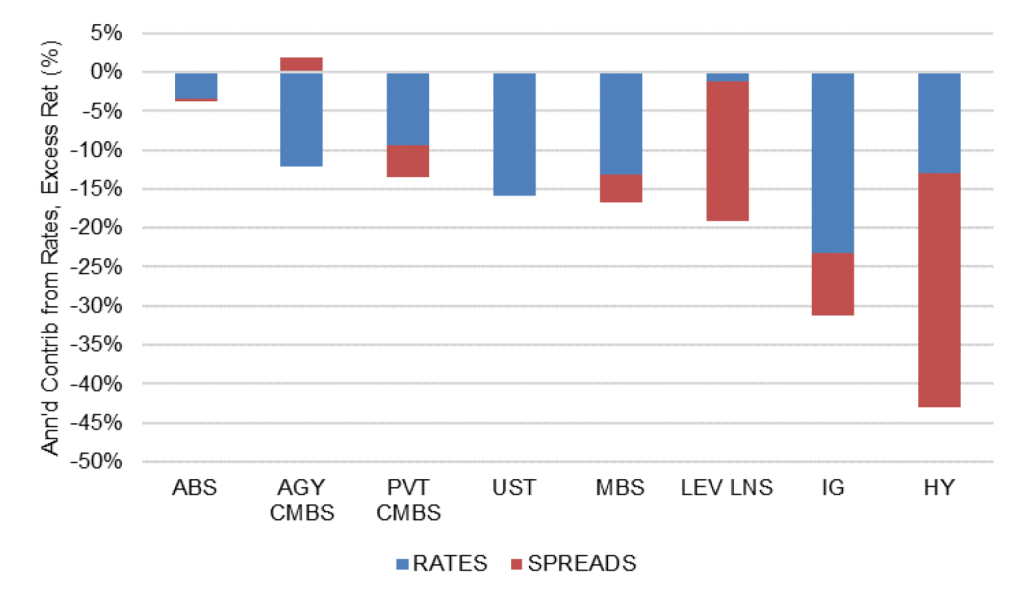
Note: Annualized daily returns and volatility based on Bloomberg/Barclays indices in each asset class except leveraged loans, which is based on the S&P/LSTA Total Return Index.
Source: Bloomberg, S&P, Amherst Pierpont Securities
The impact of spreads is especially clear compared to results from the first quarter (Exhibit 4). Wider spreads pushed leveraged loans from the best performing sector in the first quarter to the third worst performing in the second, and high yield went from the third best to the worst. In the first quarter, higher rates played a much bigger role than spreads across sectors. In broad terms, the market repriced the Fed in the first quarter and repriced recession risk in the second.
Exhibit 4: In 1Q22, it was much more about rates than spreads
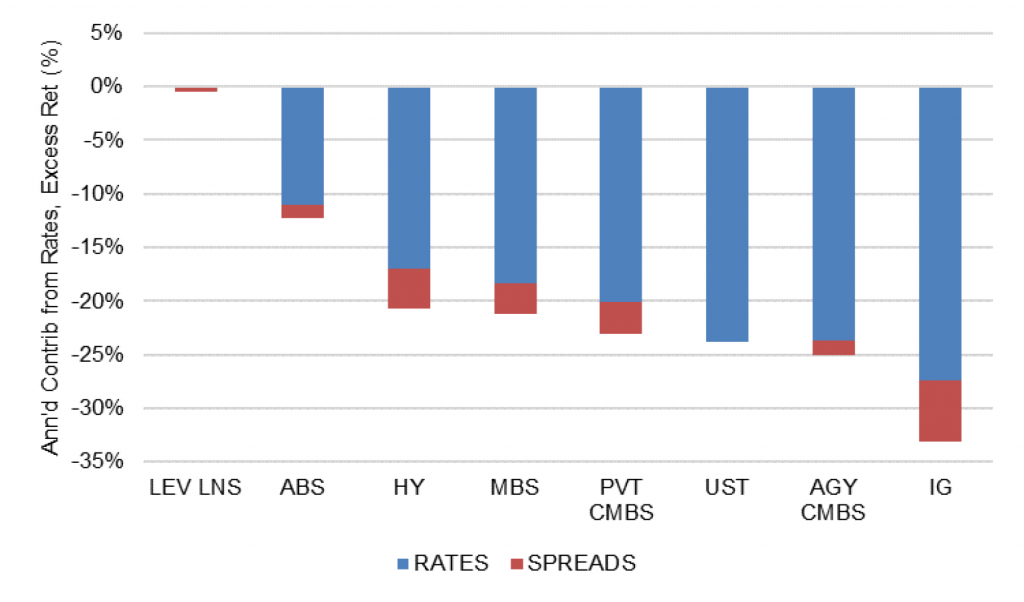
Note: Annualized daily returns and volatility based on Bloomberg/Barclays indices in each asset class except leveraged loans, which is based on the S&P/LSTA Total Return Index.
Source: Bloomberg, S&P, Amherst Pierpont Securities
Implications for markets
Fed policy in 2008, 2018 and 2020 imply the Fed could pull up short if markets, the economy or both show stress. But outside of a liquidity event—a freeze in Treasury or corporate markets, perhaps—that seems unlikely. The difference this time is an inflation fight the Fed needs to win. Pulling up short would only encourage markets to assume higher inflation risk in the future, forcing sharper tightening and higher recession risk down the road. A Fed biased to stay tighter for longer even at the risk of recession has a few implications for markets:
- The curve needs to continue inverting between 2- and 10-year rates, with 2-year rates likely to range around 3.50% and 10-year rates around 2.75%
- Rate volatility looks likely to hold at current high levels or go higher as the Fed, the economy and the markets continue to figure out the trajectory of inflation
- Higher volatility should keep nominal spreads in credit and MBS wide or push them wider, although credit is likely to underperform as growth slows and prospects of recession rise
Implications for portfolio positioning
- Portfolios investing for absolute return. Buy and hedge rate and volatility risk in strong assets with good relative value, which looks plentiful in ‘AAA’ CLOs, ‘AAA’ CRE CLOs, ‘AAA’ conduit CMBS, ‘AAA’ private MBS and agency MBS.
- Benchmarked portfolios. Allocate out of ‘BBB’ corporate credit partly toward stronger corporate and structured issuers and partly into agency MBS.
- Bank portfolios. Barbell cash and 10-year assets so the cash yield will ride up with fed policy rates and the 10-year generate gains if yields at the long end hold or go lower
- Insurance portfolios. Take advantage of the relative value in less liquid structured products.
* * *
The view in rates
The headline and core CPI surprise in June just adds to inflation concerns. The Fed should push funds close to 4% by early next year, which should invert the yield curve. The 2-year rate should approach 3.5%. Fair value at 10-year and longer maturities still looks solidly in the neighborhood of 2.50%, but the possibility of a sustained fight with inflation may require compensation above fair value even in long maturities.
Fed RRP balances closed Friday at $2.15 trillion. The supply of Treasury bills continues to come down, with bills trading at yields below the RRP’s current 1.55% rate out to late August. Money market funds have little alternative but to put proceeds into RRP.
Settings on 3-month LIBOR have closed Friday at 274 bp. Setting on 3-month term SOFR closed Friday at 255 bp.
The 10-year note has finished the most recent session around 2.91%, down 17 bp on the week. Breakeven 10-year inflation finished the week at 237 bp, unchanged from a week before. The 10-year real rate finished the week at 55 bp, down 17 bp on the week.
The Treasury yield curve has finished its most recent session with 2s10s at -21 bp, an added 18 bp of inversion on the week. The 5s30s finished the most recent session at 4 bp, flatter by 8 bp on the week.
The view in spreads
MBS should outperform credit as the Fed tightens and growth slows. Nominal par 30-year MBS spreads to the blend of 5- and 10-year Treasury yields finished the most recent session at 140 bp, unchanged on the week. At this point, those spreads reflect the Fed path, volatility, balance sheet normalization and the risk of MBS sales. MBS OAS, on the other hand, has been slowly tightening, suggesting good net demand. Credit spreads seem insufficient to cover the spread volatility likely as growth slows and concern about recession grows. After nearly two years of better performance in credit, the tide should start to turn toward MBS.
The view in credit
Credit fundamentals should soften as the Fed dampens demand and growth begins to slow. In some quarters, the conversation has turned from whether recession will arrive to the shape of recession once it does. Corporations have strong earnings for now, good margins for now, low multiples of debt to gross profits, low debt service and good liquidity. It will be important to watch inflation and see if costs begin to catch up with revenues. A recent New York Fed study argues inflation generally helps companies lift gross margins. A higher real cost of funds would start to eat away at highly leveraged balance sheets with weak or volatile revenues. Consumer balance sheets look strong with rising income, substantial savings and big gains in real estate and investment portfolios. Homeowner equity jumped by $3.5 trillion in 2021, and mortgage delinquencies have dropped to a record low. But inflation and recession could take a toll and add credit risk to consumer balance sheets.