


By the Numbers
Trading MBS below par
Brian Landy, CFA | July 8, 2022
This material is a Marketing Communication and does not constitute Independent Investment Research.
The shift to higher mortgage rates this year has changed the nature of MBS prepayments. Mortgage rates have declined for more than 40 years with any pause or increase short and followed by another drop to lower rates. Each move lower unleashed a new refinance wave in MBS. But today the average MBS is trading around $90-00, and few borrowers can refinance into a lower rate. Investors have started to search for faster prepayment speeds to provide extension protection. Housing turnover, interest rates and home equity all promise to play key parts in determining relative prepayment speeds and relative value across MBS.
For a slide presentation of Trading MBS below par, including relative value ideas, click here.
The MBS market is priced at the lowest levels in over 20 years
The average agency MBS pool traded below $90-00 in June, a sharp drop from the start of the year (Exhibit 1). Since the start of 2001, the average MBS never traded below $95-00, and that was before the 2008 financial crisis. The MBS market may never have traded this far below par. Furthermore, more than 95% of the market is trading at a discount to par. This means that prepayments due to rate or term refinancing should nearly vanish. New loan origination should be dominated by loans for home purchases and possibly some cash-out refinancing.
Exhibit 1. The average 30-year MBS pool is trading below $90-00
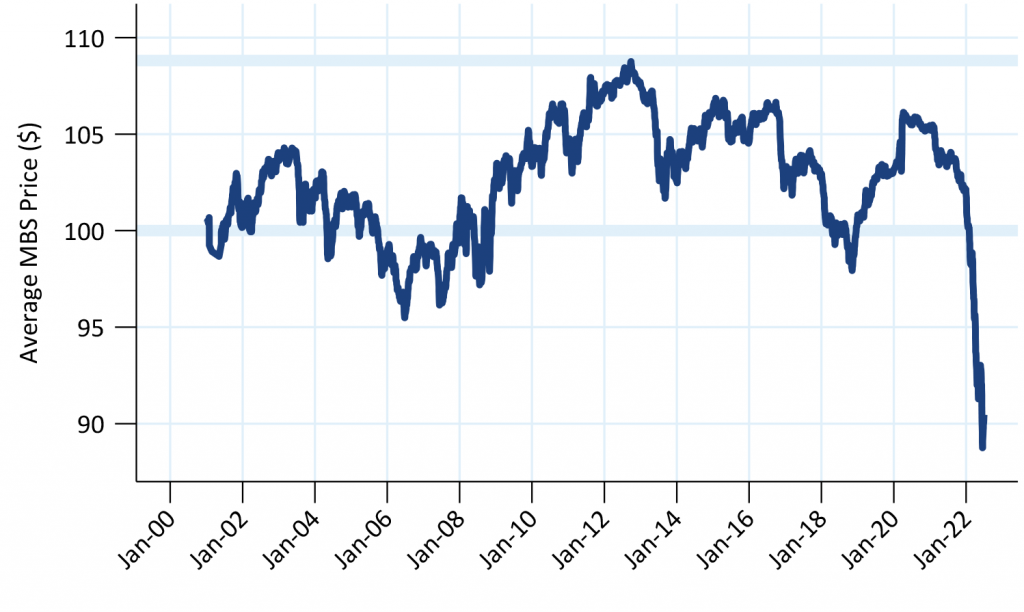
Source: Fannie Mae, Freddie Mac, Ginnie Mae, Yield Book, Amherst Pierpont Securities
Small speed differences can have a big effect on MBS value
Small speed differences can have a large effect on MBS valuations for bonds priced below par (Exhibit 2). The table shows the theoretical effect on valuation if prepayment speeds are faster or slower than the baseline projection for an MBS at a given dollar price. For example, a $95-00 MBS (6 WALA) is projected to prepay at 7.2 CPR lifetime. If that MBS prepays 10% slower, it should lose 5.5/32s of value. But if it prepays 10% faster, it will gain 5.5/32s. A 0.7 CPR difference would not have that large of an effect in a refinance environment when speeds might be four time to five times faster.
Exhibit 2. Small speed differences matter at prices below par
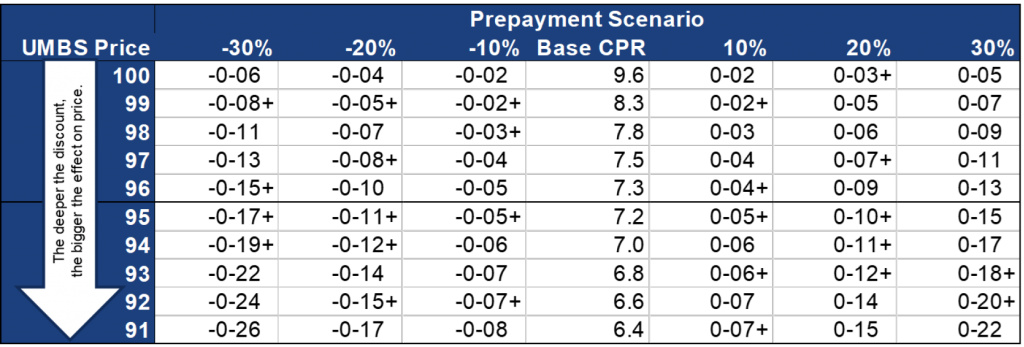
Speeds calculated using a FNCL 3.5% MBS with 4.29% gwoss WAC, 6 WALA, 352 WAM, and $412k WALS. For each row an instantaneous parallel rate shock is found that prices the MBS at constant OAS using that row’s price; this determines the base case CPR. The turnover prepayment speed is shocked up or down and run at constant OAS to find the price difference. The CPR is projected WAL-equivalent lifetime CPR.
Source: Yield Book, Amherst Pierpont Securities
Turnover prepayment speeds can be inferred from existing home sales
Existing home sales data can provide insights into how often people buy new homes (Exhibit 3). The dark blue line shows an estimate of turnover prepayment speeds found by comparing existing home sales to the size of the existing housing. The light blue line calculates a similar measure using homeowner mobility data collected in the Census’s annual American Community Survey. The survey asks people if their address is the same as it was one year ago; looking at this for the subset of people who owned homes a year ago provides another estimate of housing turnover.
Exhibit 3. Overall turnover levels can be estimated using home sales
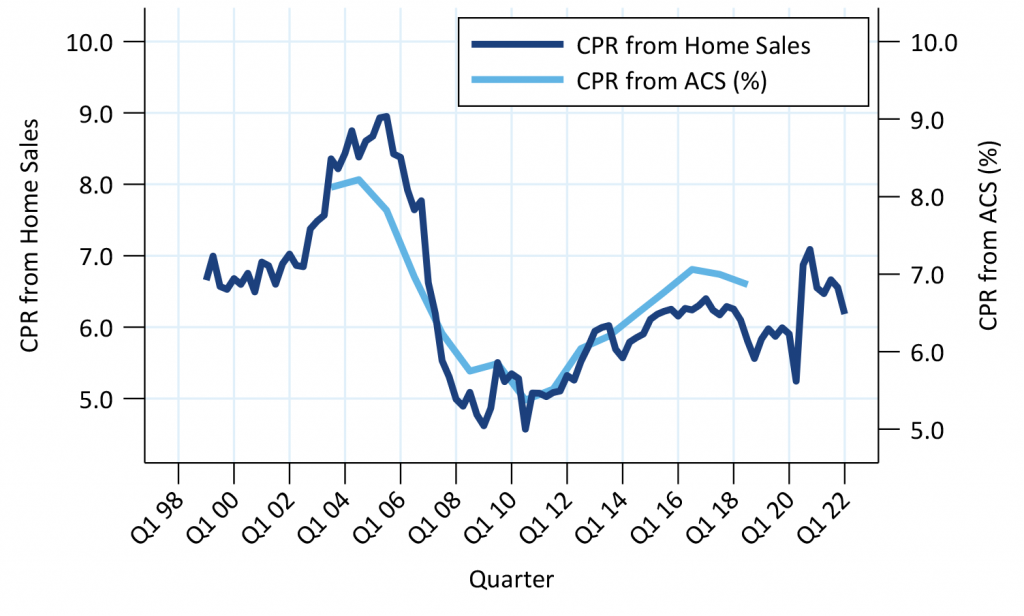
Housing turnover speed estimated using existing home sales and housing stock.
Source: US Census Bureau American Community Survey, NAR, Amherst Pierpont Securities. ACS mobility data presented as-of July 1 of the year before ACS reporting.
The two lines are generally similar and point to a baseline turnover speed of about 6.5 CPR. Prior to the financial crisis speeds were faster, especially during the housing boom. The two metrics diverged from 2003 through 2008, likely due to the popularity of home flipping. The existing home sales data includes multiple sales of the same property in a year, but the ACS data will miss that. Speeds fell as low as 5 CPR during and after the crisis, when home values plummeted, and many borrowers were underwater on their loans. Since then, speeds have recovered back to the 6.0 to 6.5 CPR area, although bumped higher during the pandemic. Supply constraints likely prevented turnover speeds from jumping even higher.
Since 2014 the ACS data has pointed to faster turnover than the home sales data. A possible explanation is the growth of single-family rentals, which may still be included in the 1- to 4-family housing stock but no longer turnover when occupants move.
For MBS investors the existing home sales data and mobility data can provide some useful insights about borrower behavior that may be difficult to find in limited mortgage prepayment data. Past turnover environments were shallow and rarely lasted very long, which makes it difficult to extract estimates of turnover speeds from that data. Of course, these measures are not a perfect replica of MBS prepayment speeds. For example, they include people that own homes outright, and the turnover behavior of people with mortgages might be different from those that own their homes.
Housing turnover slows when interest rates increase
More people tend to buy homes when interest rates are low and financing is inexpensive (Exhibit 4). This is part of the reason that turnover increased, and home prices boomed, from 2003 through 2006. Low mortgage rates also contributed to the jump in housing activity during the pandemic in 2020 and 2021. Many people took advantage of low rates and were able to relocate to places like Florida to work remotely. Though low rates are not the only driver of housing turnover, which is demonstrated by slow turnover from 2008 through 2013 despite mortgage rates falling to record low levels.
Exhibit 4. More people buy homes when financing is cheap
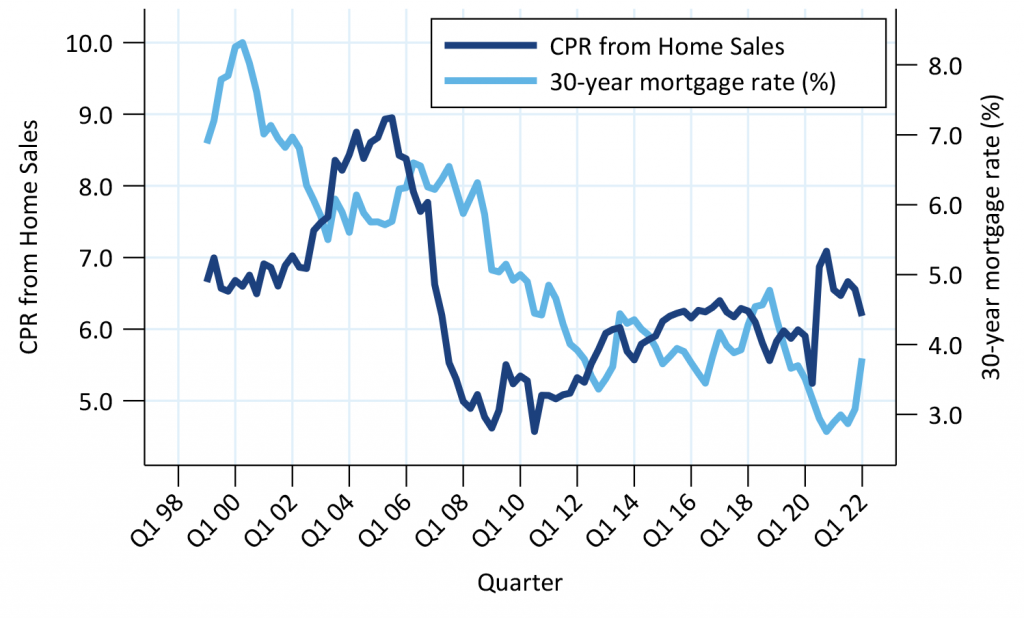
Housing turnover speed estimated using existing home sales and housing stock.
Source: Freddie Mac, Bloomberg, NAR, US Census Bureau, Amherst Pierpont Securities
Housing turnover increases when homeowners have equity
Home equity is a major contributor to housing turnover (Exhibit 5). Annual home price appreciation was high from 2000 through 2006, which eventually helped push turnover to nearly 9 CPR in 2004 and 2005. Turnover fell alongside home prices from 2006 through 2008, and turnover started to recover when home price growth picked up in 2013.
Exhibit 5. Home equity allows borrowers to buy more expensive homes
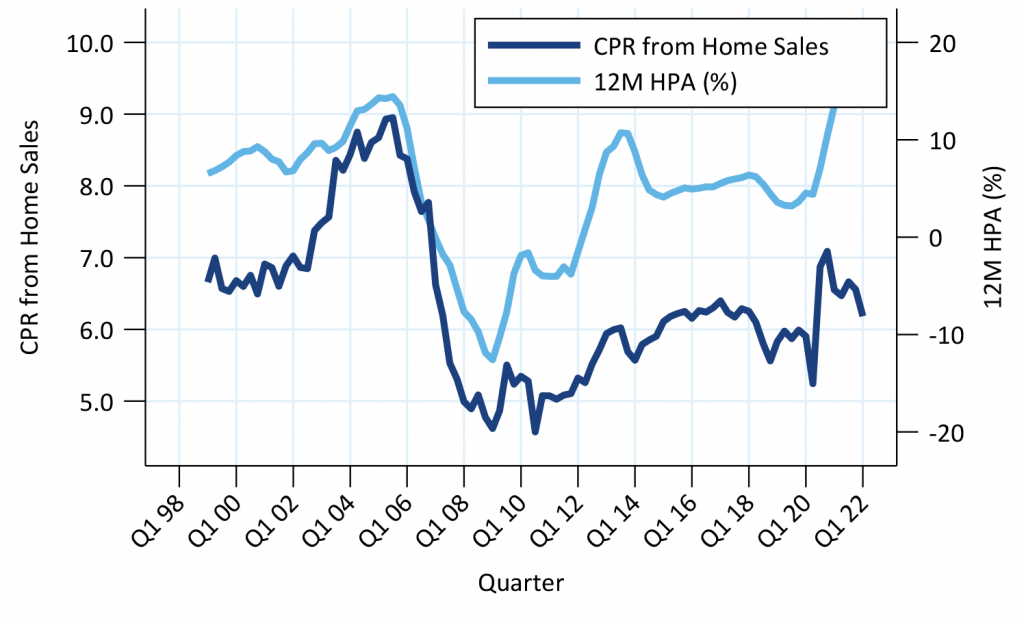
Housing turnover speed estimated using existing home sales and housing stock.
Source: S&P Case Shiller, NAR, US Census Bureau, Amherst Pierpont Securities
Most people need to borrower money to buy a home. When home prices increase, this leverage boosts the borrower’s return on equity. This equity growth can be used to buy a more expensive home. For example, consider a borrower who bought a $300,000 home in 2020 with a 20% down payment. If that home appreciated 33% the home is worth $400,000, but the borrower’s equity has increased 166% to $160,000 from $60.000. That borrower could make a 20% down payment on a new home worth up to $800,000. The borrower would also need more income to support the larger mortgage payment, but home equity unlocks housing turnover.
Turnover should slow in a recession
A strong economy with low unemployment also contributes to faster turnover (Exhibit 6). Unemployment jumped in 2008 and 2009 at the same time turnover slowed. And unemployment slowly recovered from 2010 through 2019, contributing to the pickup in turnover over those years. At the start of the pandemic there was a deep, but short-lived, crash in home sales that occurred when unemployment skyrocketed.
Exhibit 6. Fewer borrowers move when the economy is weak
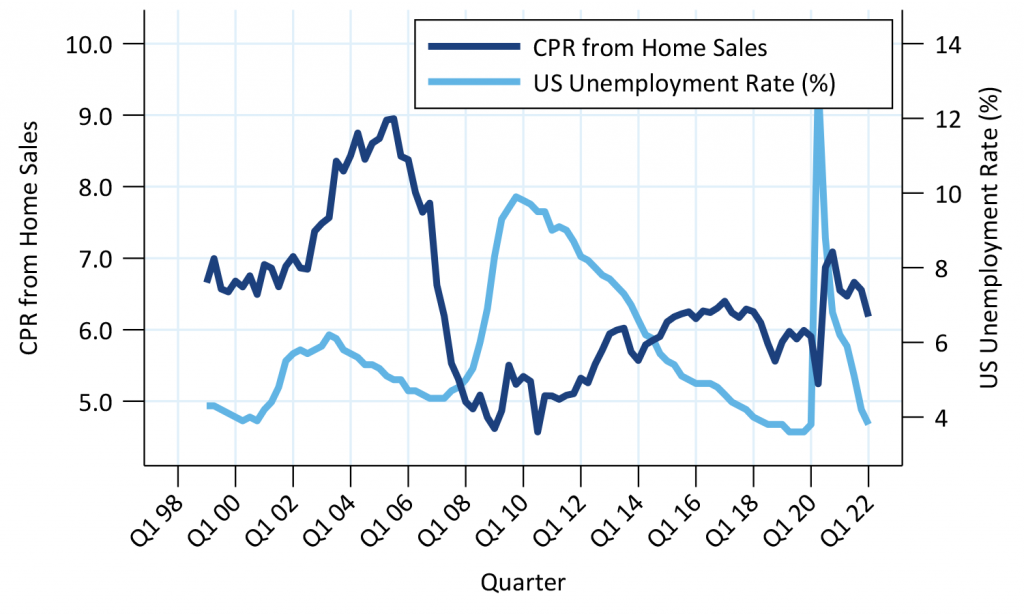
Housing turnover speed estimated using existing home sales and housing stock.
Source: BLS, NAR, US Census Bureau, Amherst Pierpont Securities
Cash-out refinancing also depends on mortgage rates and equity
Cash-out refinancing also contributes to discount prepayment speeds, but some borrowers only cash out when financing is inexpensive (Exhibit 7). This estimates cash-out speeds by comparing the volume of new agency cash-out production to the outstanding balance of agency MBS. Most agency cash-out mortgages were refinances of existing agency loans, so this should closely estimate the prepayment speed due to cash-out activity. Cash-out volume jumped in 2020 and 2021, driven in part by low mortgage rates. Many borrowers are opportunistic about cash-out refinancing—they will only do a cash-out refinance when they can also lower their mortgage rate.
Exhibit 7. Cash-out refinancing increases when financing is cheap
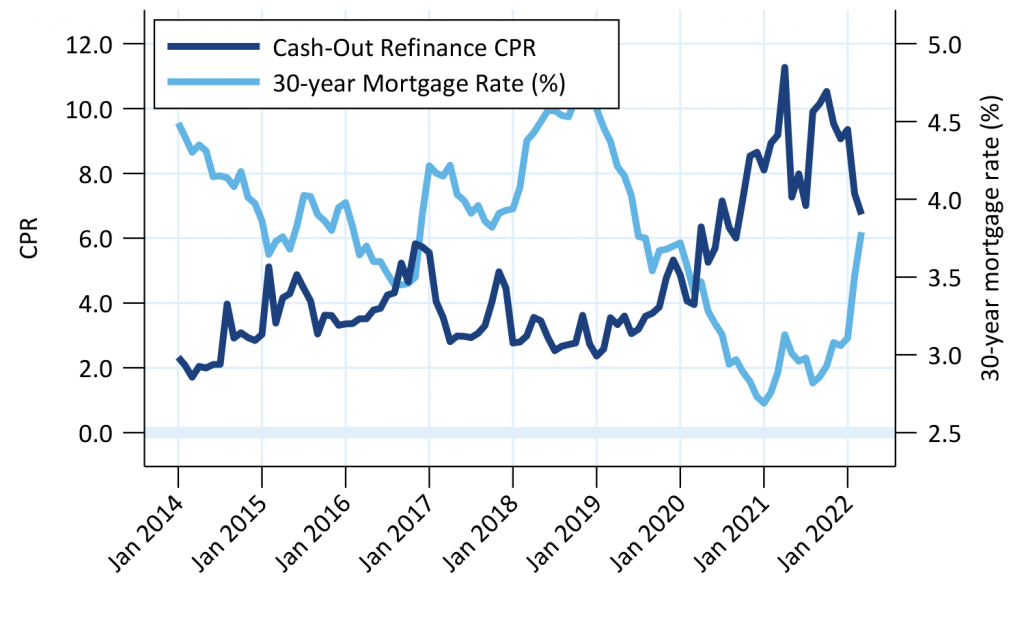
Cash-out refinance speeds estimated comparing cash-out issuance volume to outstanding pool balance.
Source: Fannie Mae, Freddie Mac, Amherst Pierpont Securities
Borrowers are also more likely to cash-out refinance when they have more equity in their homes (Exhibit 8). This compares the pace of cash-out refinancing to the average current LTV of the agency MBS universe, after accounting for amortization and home price appreciation. The average LTV slowly fell from 2014 through 2019, then plummeted during the pandemic. This contributed to the cash-out refinancing boom in 2021 and 2022.
Exhibit 8. Cash-out refinancing is higher when borrowers have more home equity
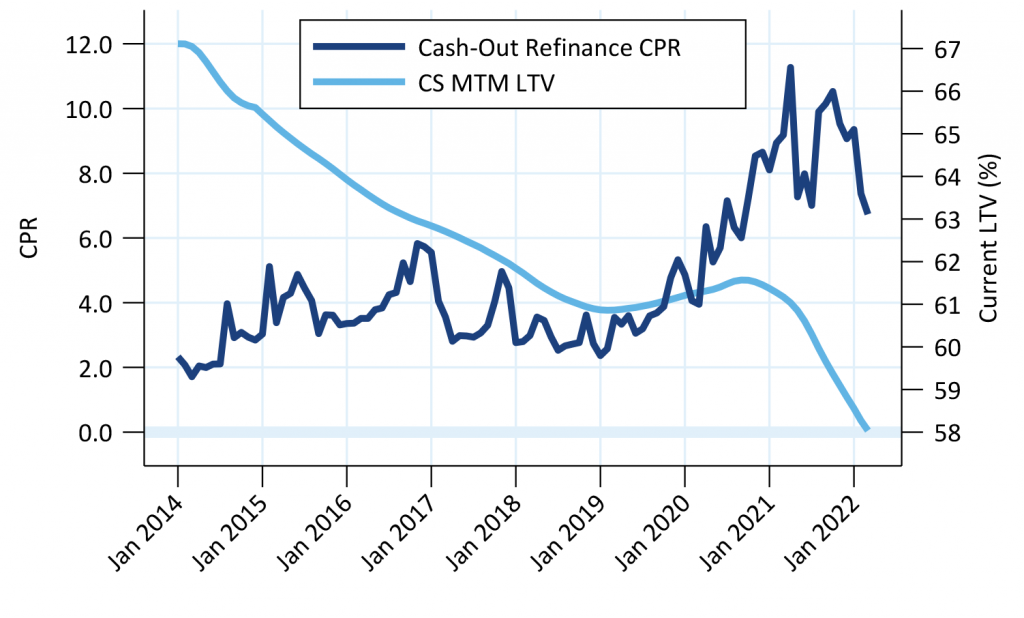
Cash-out refinance speeds estimated comparing cash-out issuance volume to outstanding pool balance. Current LTV is the average of all outstanding 30-year MBS.
Source: Fannie Mae, Freddie Mac, Amherst Pierpont Securities
The twin effects of record low mortgage rates and record high home price appreciation pushed cash-out refi speeds close to 10 CPR in 2021. But the higher rate environments in 2014, 2017 and 2018 point to speeds closer to 2.0 to 2.5 CPR in the coming months. It seems likely that cash-out refi speeds will fall to this level soon. Even though rates are very high, a cash-out refinance may still benefit borrowers consolidating high interest rate credit card debt.
One risk to cash-out speeds is the potential that originators successfully ramp up origination of closed-end 2nd liens and HELOCs. These products would let borrowers access equity without prepaying their low-rate 1st lien. However, 2nd liens have historically been bank products with limited securitization; most production was retained on bank balance sheets. Lenders like Quicken are attempting to get into this business but will need to securitize these loans, which may limit production.
The need to market securitizations could cause lenders to target better-credit borrowers for 2nd liens and HELOCs and use agency-guaranteed cash-out refinance for borrowers with weak credit. Many of the better-credit borrowers may also be the opportunistic borrowers that only cash-out when rates are also low. If that proves true then a rise in 2nd lien lending may not have much effect on the baseline cash-out CPR.