The Long and Short
A strong start for Interpublic should close the gap to peers
This material is a Marketing Communication and does not constitute Independent Investment Research.
Interpublic Group’s strong performance in the first quarter this year coupled with its better-than-expected results during the pandemic sets the stage for IPG to trade through peers, including Omnicom Group (OMC). IPG maintains a slightly stronger balance sheet than OMC, and a free cash flow performance that outpaces it by nearly 600 bp. Management recently upped its forecast for organic revenue growth for 2022, off a very strong fiscal 2021 comparison. IPG bonds trade 10 bp to 15 bp wide to OMC – a difference that should collapse as the year progresses The company could also be viewed as an upgrade candidate by both Moody’s and S&P, providing a catalyst for further spread tightening.
Exhibit 1. BBB Media 7-10 year Curve
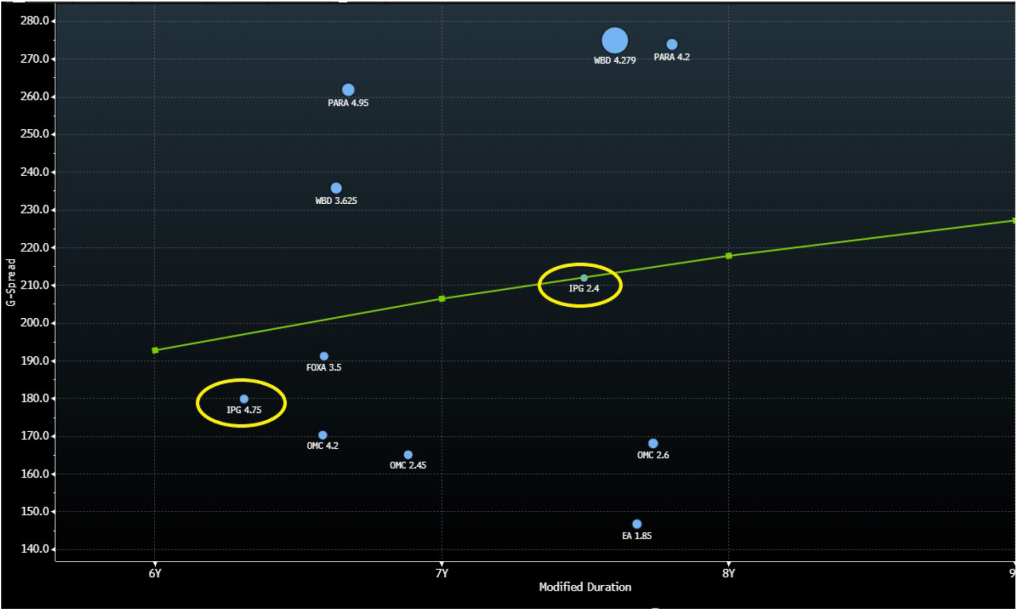
Source: Bloomberg TRACE; APS
A Strong Start to the Year
IPG posted strong fiscal 1Q22 results underscored by double-digit organic revenue growth in each of its three reportable segments, despite continued macro uncertainty and geopolitical risk. Organic net revenues were up 11.5% on a consolidated basis with the U.S. witnessing growth of 12.2% and the International segment posting organic growth of 10.2%. IPG reported the largest organic growth rate in Latin America, which saw organic growth up 21.5%. Management noted that its global growth was driven by consistent increases across all client sectors. Adjusted EBITA in the quarter was up slightly from the year ago period. Given the strong top line growth, the EBITA margin contracted 80 bp year-over-year to 12.3%. However, we note that costs went up significantly, as headcount grew by 11% year-over-year and business travel resumed as employees returned to offices. Despite the margin contraction in the quarter, we note that on a LTM basis the EBITA margin is closer to 16.5% and is forecasted to be 16.6% for the full year. This puts IPG on par with OMC with respect to margins. Additionally, IPG’s free cash flow performance has been a real strength, with FCF/sales of 14.2% on a LTM basis. This compares very favorably to OMC, whose FCF/sales metric is nearly 600 bp lower at 8.3% (Exhibit 2).
Exhibit 2. IPG vs. OMC LTM Financial Performance
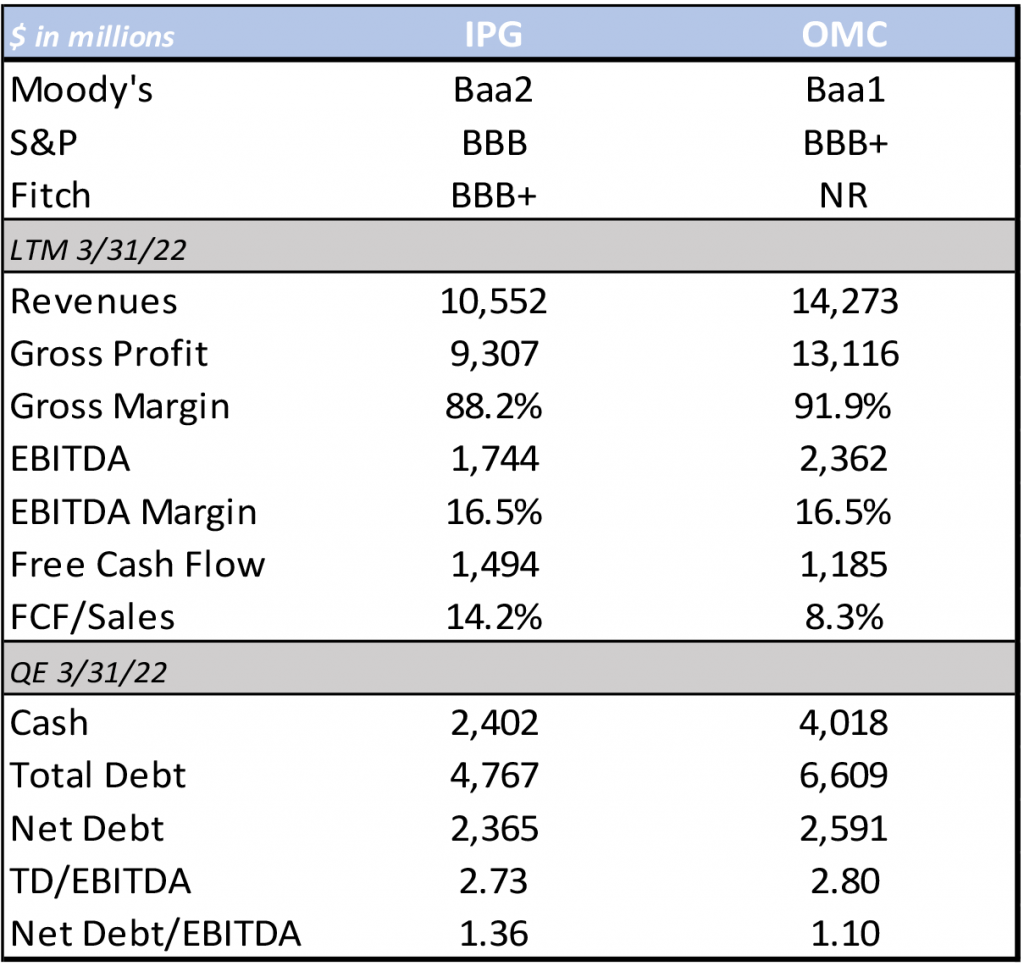
Source: Company Reports; APS
Balance Sheet and Liquidity Supports Higher Ratings
IPG ended the quarter with total leverage of 2.73x, which we note is slightly better than OMC’s leverage of 2.8x. On a net basis, IPG’s leverage is over a turn less at 1.36x, supported by its strong cash position of $2.4bn. OMC maintains a larger cash position, which puts its net leverage a bit lower than IPG’s at 1.1x (Exhibit 2). However, we note that OMC’s debt maturity profile is more front-end loaded relative to IPG’s. OMC’s weighted average debt maturity is 6.35 years, which we note is roughly half of IPG’s, which currently stands at 12.19 years. That said, OMC has more refinancing risk in the rising rate environment that we are currently in. Both IPG and OMC’s next debt maturity is not until 2024, which provides them both with some runway. However, OMC has nothing maturing past 2033 while IPG has 20 year and 30 year debt outstanding (Exhibit 3). Additionally, OMC’s deals are much larger than IPG’s as it currently has three debt maturity walls over $1bn. IPG’s largest debt maturity year is 2030, when $650mm comes due.
Exhibit 3. IPG vs. OMC Debt Maturity Schedule
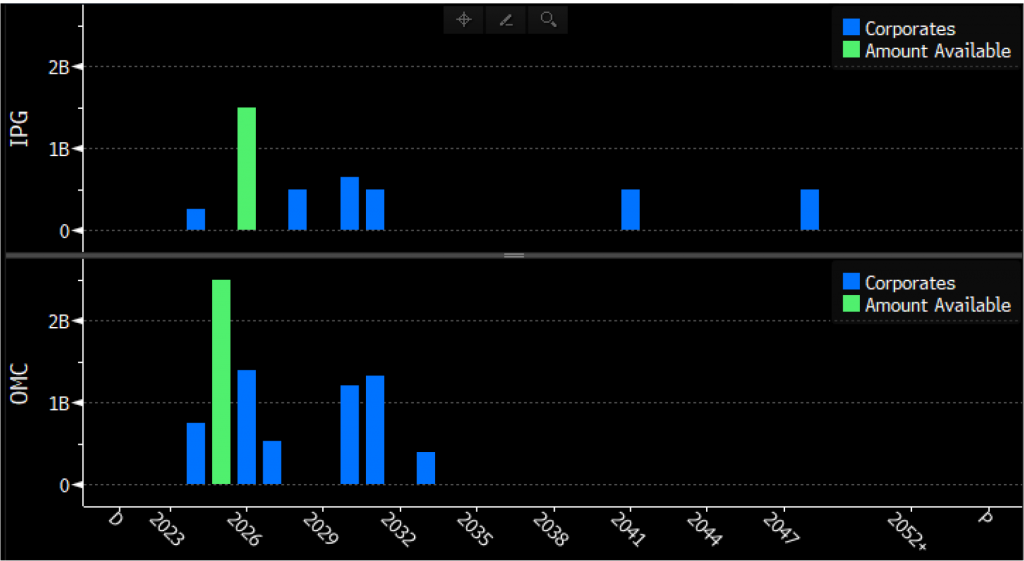
Source: Bloomberg; APS
Leverage Within Target Range for Upgrade Based on S&P Adjustments
We note that S&P makes certain adjustments when calculating IPG’s leverage. S&P looks at IPG’s leverage from a net basis and expects adjusted leverage to be in the low 1.0x area over the next two years. Currently, S&P’s threshold for an upgrade is to maintain adjusted leverage below 2.0x, with it currently at 1.3x. In addition to the maintenance of adjusted leverage below the aforementioned threshold, the agency would like IPG to sustain positive organic growth and favorable EBITA margins. Based on IPG’s full year guidance of organic revenue growth of 6% and an EBITA margin of 16.6%, IPG’s metrics are within S&P’s framework required for an upgrade.
Moody’s has yet to revisit IPG’s rating, but previously noted that leverage needed to be maintained below 2.75x. While there were some constraints to the rating due to its revenue base, revenues are now above $10bn. That said, IPG is now of scale to be considered for an upgrade relative to global peers. Additionally, IPG has demonstrated its ability to weather economic challenges better than peers as well as its ability to grow revenues organically while expanding margins.
This material is intended only for institutional investors and does not carry all of the independence and disclosure standards of retail debt research reports. In the preparation of this material, the author may have consulted or otherwise discussed the matters referenced herein with one or more of SCM’s trading desks, any of which may have accumulated or otherwise taken a position, long or short, in any of the financial instruments discussed in or related to this material. Further, SCM may act as a market maker or principal dealer and may have proprietary interests that differ or conflict with the recipient hereof, in connection with any financial instrument discussed in or related to this material.
This message, including any attachments or links contained herein, is subject to important disclaimers, conditions, and disclosures regarding Electronic Communications, which you can find at https://portfolio-strategy.apsec.com/sancap-disclaimers-and-disclosures.
Important Disclaimers
Copyright © 2026 Santander US Capital Markets LLC and its affiliates (“SCM”). All rights reserved. SCM is a member of FINRA and SIPC. This material is intended for limited distribution to institutions only and is not publicly available. Any unauthorized use or disclosure is prohibited.
In making this material available, SCM (i) is not providing any advice to the recipient, including, without limitation, any advice as to investment, legal, accounting, tax and financial matters, (ii) is not acting as an advisor or fiduciary in respect of the recipient, (iii) is not making any predictions or projections and (iv) intends that any recipient to which SCM has provided this material is an “institutional investor” (as defined under applicable law and regulation, including FINRA Rule 4512 and that this material will not be disseminated, in whole or part, to any third party by the recipient.
The author of this material is an economist, desk strategist or trader. In the preparation of this material, the author may have consulted or otherwise discussed the matters referenced herein with one or more of SCM’s trading desks, any of which may have accumulated or otherwise taken a position, long or short, in any of the financial instruments discussed in or related to this material. Further, SCM or any of its affiliates may act as a market maker or principal dealer and may have proprietary interests that differ or conflict with the recipient hereof, in connection with any financial instrument discussed in or related to this material.
This material (i) has been prepared for information purposes only and does not constitute a solicitation or an offer to buy or sell any securities, related investments or other financial instruments, (ii) is neither research, a “research report” as commonly understood under the securities laws and regulations promulgated thereunder nor the product of a research department, (iii) or parts thereof may have been obtained from various sources, the reliability of which has not been verified and cannot be guaranteed by SCM, (iv) should not be reproduced or disclosed to any other person, without SCM’s prior consent and (v) is not intended for distribution in any jurisdiction in which its distribution would be prohibited.
In connection with this material, SCM (i) makes no representation or warranties as to the appropriateness or reliance for use in any transaction or as to the permissibility or legality of any financial instrument in any jurisdiction, (ii) believes the information in this material to be reliable, has not independently verified such information and makes no representation, express or implied, with regard to the accuracy or completeness of such information, (iii) accepts no responsibility or liability as to any reliance placed, or investment decision made, on the basis of such information by the recipient and (iv) does not undertake, and disclaims any duty to undertake, to update or to revise the information contained in this material.
Unless otherwise stated, the views, opinions, forecasts, valuations, or estimates contained in this material are those solely of the author, as of the date of publication of this material, and are subject to change without notice. The recipient of this material should make an independent evaluation of this information and make such other investigations as the recipient considers necessary (including obtaining independent financial advice), before transacting in any financial market or instrument discussed in or related to this material.
Important disclaimers for clients in the EU and UK
This publication has been prepared by Trading Desk Strategists within the Sales and Trading functions of Santander US Capital Markets LLC (“SanCap”), the US registered broker-dealer of Santander Corporate & Investment Banking. This communication is distributed in the EEA by Banco Santander S.A., a credit institution registered in Spain and authorised and regulated by the Bank of Spain and the CNMV. Any EEA recipient of this communication that would like to affect any transaction in any security or issuer discussed herein should do so with Banco Santander S.A. or any of its affiliates (together “Santander”). This communication has been distributed in the UK by Banco Santander, S.A.’s London branch, authorised by the Bank of Spain and subject to regulatory oversight on certain matters by the Financial Conduct Authority (FCA) and the Prudential Regulation Authority (PRA).
The publication is intended for exclusive use for Professional Clients and Eligible Counterparties as defined by MiFID II and is not intended for use by retail customers or for any persons or entities in any jurisdictions or country where such distribution or use would be contrary to local law or regulation.
This material is not a product of Santander´s Research Team and does not constitute independent investment research. This is a marketing communication and may contain ¨investment recommendations¨ as defined by the Market Abuse Regulation 596/2014 ("MAR"). This publication has not been prepared in accordance with legal requirements designed to promote the independence of research and is not subject to any prohibition on dealing ahead of the dissemination of investment research. The author, date and time of the production of this publication are as indicated herein.
This publication does not constitute investment advice and may not be relied upon to form an investment decision, nor should it be construed as any offer to sell or issue or invitation to purchase, acquire or subscribe for any instruments referred herein. The publication has been prepared in good faith and based on information Santander considers reliable as of the date of publication, but Santander does not guarantee or represent, express or implied, that such information is accurate or complete. All estimates, forecasts and opinions are current as at the date of this publication and are subject to change without notice. Unless otherwise indicated, Santander does not intend to update this publication. The views and commentary in this publication may not be objective or independent of the interests of the Trading and Sales functions of Santander, who may be active participants in the markets, investments or strategies referred to herein and/or may receive compensation from investment banking and non-investment banking services from entities mentioned herein. Santander may trade as principal, make a market or hold positions in instruments (or related derivatives) and/or hold financial interest in entities discussed herein. Santander may provide market commentary or trading strategies to other clients or engage in transactions which may differ from views expressed herein. Santander may have acted upon the contents of this publication prior to you having received it.
This publication is intended for the exclusive use of the recipient and must not be reproduced, redistributed or transmitted, in whole or in part, without Santander’s consent. The recipient agrees to keep confidential at all times information contained herein.


