By the Numbers
Low issuance and tight spreads in agency CMBS
This material is a Marketing Communication and does not constitute Independent Investment Research.
A slowdown in commercial real estate transactions has had a pronounced impact on the multifamily sector, with Fannie Mae and Freddie Mac both likely to come in significantly below their multifamily issuance caps for the year. The slowdown has kept a lid on agency CMBS spreads despite other sectors in securitized products touching recent wides. For banks and insurance companies that need the lower risk weighting and agency guarantee, the better relative value is currently in 10/9.5 DUS, thanks to a recent modest widening compared to 10-year K-deal A2 and AM classes. Some vintages of fixed-rate DUS are also prepaying a bit faster than historical averages, so these pools could potentially produce a bit of excess return.
Commercial real estate transaction volumes have slowed, and multifamily properties are no exception. Fannie Mae DUS issuance is $20 billion year-to-date through May, with total issuance of $25 billion. Agency multifamily issuance is traditionally a bit backloaded in the fourth quarter, but it is unlikely to accelerate much with the Fed in a hiking cycle through year-end. The multifamily loan purchase caps are $78 billion for each enterprise for 2022. At the current rate, projected DUS issuance for 2022 would be $48 billion; Fannie’s total multifamily issuance would be $60 billion, or 23% below the $78 billion cap.
Exhibit 1: A slowdown in Fannie Mae multifamily issuance
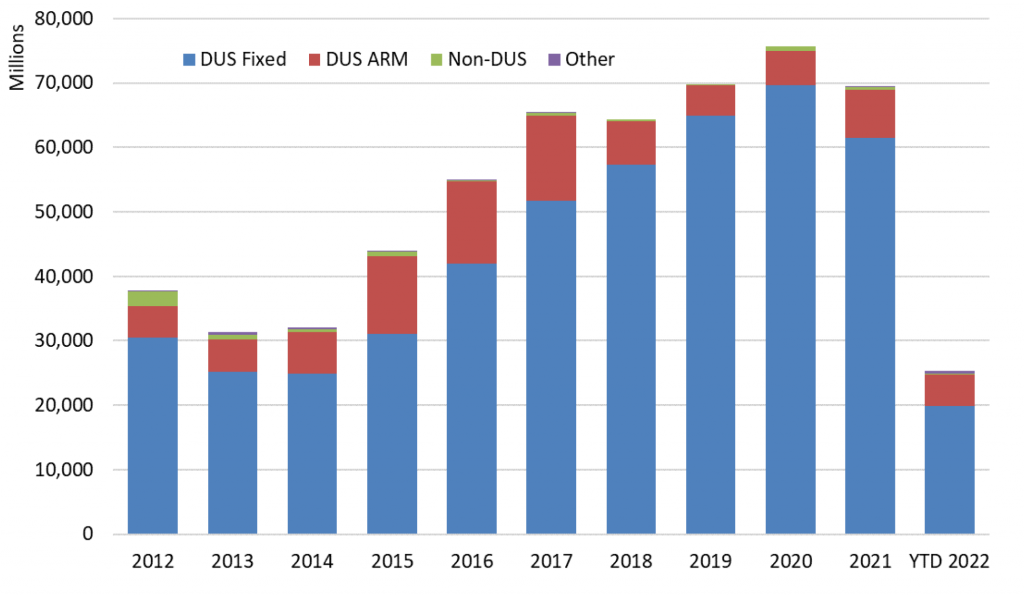
Note: Data through May 2022.
Source: Fannie Mae, Amherst Pierpont Santander
Freddie Mac’s multifamily pipeline is tepid as well, with a single 10-year fixed-rate K-deal coming to market in each of May and June. The WI certificates for the K148 deal were the most recent to price on June 6. The K148 deal is on the calendar to be completed on September 8, but there are no new fixed-rate deals pricing in the interim. Two floating rate K deals are scheduled to come to market over the summer, along with a few small balance and supplemental deals.
Low issuance has kept a lid on spreads
Spreads across most securitized products market have widened against a backdrop of volatile rates, high inflation and recession fears. Agency CMBS spreads, with their ‘AAA’ rating and guarantees, have only modestly moved higher as issuance has declined (Exhibit 2). Freddie Mac K-deal spreads at issue widened out early in the year, peaked in mid-March, then tightened and have held those levels. Part of the widening was possibly due to the integration and expansion of the WI program into the regular issuance cycle. Some investors who had previously backed away from buying WI certificates have gradually gained approval or become more comfortable with the product, and have ramped up their participation. This has arguably contributed to WI A2 spreads remaining tight while DUS 10/9.5 spreads have widened by 10 bp to 12 bp since early May. This widening puts 10/9.5 DUS back in-line with the AM as opposed to the A2 classes of Freddie K deals, which is where they tended to historically trade prior to the introduction of the WI program in the second half of 2021.
Exhibit 2: 10-year K-deal and DUS spreads
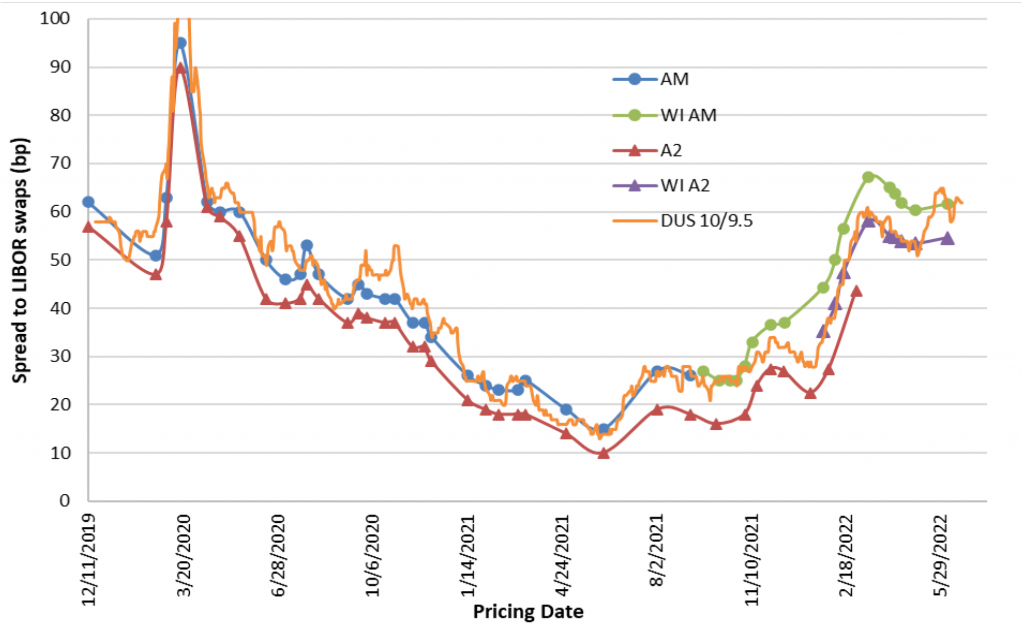
Note: Beginning in 2022, spreads at issue have been converted from SOFR back to LIBOR swap spreads.
Source: Bloomberg, Fannie Mae, Amherst Pierpont Santander
Investors hoping or waiting for agency CMBS spreads to widen are likely to be disappointed, at least while origination volume remains depressed. Fixed-rate DUS investors can often pick up some extra return when loans prepay. The yield maintenance payments on discount pools aren’t meaningful, as they’re typically zero, but having a discount pool pay off at par can generate some excess return. Prepay speeds for 10/9.5 DUS are very slow the first two years, then begin to rise gradually (Exhibit 3). DUS 10/9.5 pools from 2017 thru 2020 are currently paying off faster than historical levels, at 4 CPR up to 10 CPR. This is likely due to the strong property price appreciation of the past several years. There could be a flurry of prepayments as some investors look to sell properties if the market begins to weaken, which its already showing signs of doing.
Exhibit 3: DUS 10/9.5 CPR by vintage by WALA
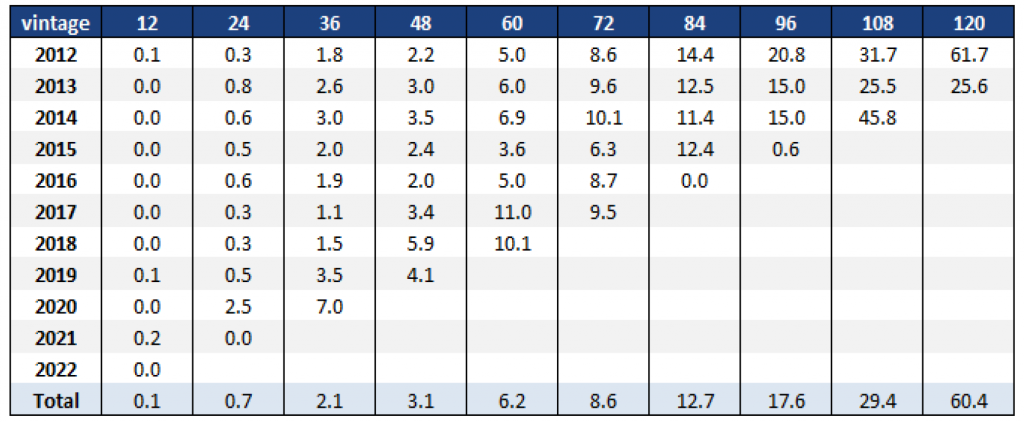
Note: Data through May 2022.
Source: Fannie Mae, Amherst Pierpont Santander
DUS ARM investors face a considerably different prepay picture (Exhibit 4). Prepays are historically low at 3 CPR during the first year, then tend to climb quickly to 18 CPR to 25 CPR during the following years. Similar to Freddie K floaters, the duration of DUS ARMs tends to be 3 to 4 years as borrowers tend to use the product for shorter-term financing, or wait for an easing cycle to lock in lower fixed rates.
Exhibit 4: DUS 10/9.5 ARM CPR by vintage by wala
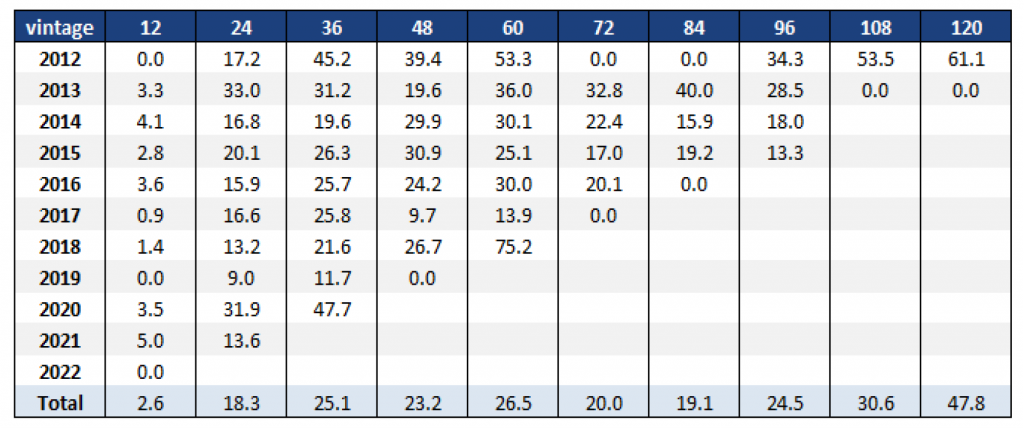
Note: Data through May 2022.
Source: Fannie Mae, Amherst Pierpont Santander
This material is intended only for institutional investors and does not carry all of the independence and disclosure standards of retail debt research reports. In the preparation of this material, the author may have consulted or otherwise discussed the matters referenced herein with one or more of SCM’s trading desks, any of which may have accumulated or otherwise taken a position, long or short, in any of the financial instruments discussed in or related to this material. Further, SCM may act as a market maker or principal dealer and may have proprietary interests that differ or conflict with the recipient hereof, in connection with any financial instrument discussed in or related to this material.
This message, including any attachments or links contained herein, is subject to important disclaimers, conditions, and disclosures regarding Electronic Communications, which you can find at https://portfolio-strategy.apsec.com/sancap-disclaimers-and-disclosures.
Important Disclaimers
Copyright © 2026 Santander US Capital Markets LLC and its affiliates (“SCM”). All rights reserved. SCM is a member of FINRA and SIPC. This material is intended for limited distribution to institutions only and is not publicly available. Any unauthorized use or disclosure is prohibited.
In making this material available, SCM (i) is not providing any advice to the recipient, including, without limitation, any advice as to investment, legal, accounting, tax and financial matters, (ii) is not acting as an advisor or fiduciary in respect of the recipient, (iii) is not making any predictions or projections and (iv) intends that any recipient to which SCM has provided this material is an “institutional investor” (as defined under applicable law and regulation, including FINRA Rule 4512 and that this material will not be disseminated, in whole or part, to any third party by the recipient.
The author of this material is an economist, desk strategist or trader. In the preparation of this material, the author may have consulted or otherwise discussed the matters referenced herein with one or more of SCM’s trading desks, any of which may have accumulated or otherwise taken a position, long or short, in any of the financial instruments discussed in or related to this material. Further, SCM or any of its affiliates may act as a market maker or principal dealer and may have proprietary interests that differ or conflict with the recipient hereof, in connection with any financial instrument discussed in or related to this material.
This material (i) has been prepared for information purposes only and does not constitute a solicitation or an offer to buy or sell any securities, related investments or other financial instruments, (ii) is neither research, a “research report” as commonly understood under the securities laws and regulations promulgated thereunder nor the product of a research department, (iii) or parts thereof may have been obtained from various sources, the reliability of which has not been verified and cannot be guaranteed by SCM, (iv) should not be reproduced or disclosed to any other person, without SCM’s prior consent and (v) is not intended for distribution in any jurisdiction in which its distribution would be prohibited.
In connection with this material, SCM (i) makes no representation or warranties as to the appropriateness or reliance for use in any transaction or as to the permissibility or legality of any financial instrument in any jurisdiction, (ii) believes the information in this material to be reliable, has not independently verified such information and makes no representation, express or implied, with regard to the accuracy or completeness of such information, (iii) accepts no responsibility or liability as to any reliance placed, or investment decision made, on the basis of such information by the recipient and (iv) does not undertake, and disclaims any duty to undertake, to update or to revise the information contained in this material.
Unless otherwise stated, the views, opinions, forecasts, valuations, or estimates contained in this material are those solely of the author, as of the date of publication of this material, and are subject to change without notice. The recipient of this material should make an independent evaluation of this information and make such other investigations as the recipient considers necessary (including obtaining independent financial advice), before transacting in any financial market or instrument discussed in or related to this material.
Important disclaimers for clients in the EU and UK
This publication has been prepared by Trading Desk Strategists within the Sales and Trading functions of Santander US Capital Markets LLC (“SanCap”), the US registered broker-dealer of Santander Corporate & Investment Banking. This communication is distributed in the EEA by Banco Santander S.A., a credit institution registered in Spain and authorised and regulated by the Bank of Spain and the CNMV. Any EEA recipient of this communication that would like to affect any transaction in any security or issuer discussed herein should do so with Banco Santander S.A. or any of its affiliates (together “Santander”). This communication has been distributed in the UK by Banco Santander, S.A.’s London branch, authorised by the Bank of Spain and subject to regulatory oversight on certain matters by the Financial Conduct Authority (FCA) and the Prudential Regulation Authority (PRA).
The publication is intended for exclusive use for Professional Clients and Eligible Counterparties as defined by MiFID II and is not intended for use by retail customers or for any persons or entities in any jurisdictions or country where such distribution or use would be contrary to local law or regulation.
This material is not a product of Santander´s Research Team and does not constitute independent investment research. This is a marketing communication and may contain ¨investment recommendations¨ as defined by the Market Abuse Regulation 596/2014 ("MAR"). This publication has not been prepared in accordance with legal requirements designed to promote the independence of research and is not subject to any prohibition on dealing ahead of the dissemination of investment research. The author, date and time of the production of this publication are as indicated herein.
This publication does not constitute investment advice and may not be relied upon to form an investment decision, nor should it be construed as any offer to sell or issue or invitation to purchase, acquire or subscribe for any instruments referred herein. The publication has been prepared in good faith and based on information Santander considers reliable as of the date of publication, but Santander does not guarantee or represent, express or implied, that such information is accurate or complete. All estimates, forecasts and opinions are current as at the date of this publication and are subject to change without notice. Unless otherwise indicated, Santander does not intend to update this publication. The views and commentary in this publication may not be objective or independent of the interests of the Trading and Sales functions of Santander, who may be active participants in the markets, investments or strategies referred to herein and/or may receive compensation from investment banking and non-investment banking services from entities mentioned herein. Santander may trade as principal, make a market or hold positions in instruments (or related derivatives) and/or hold financial interest in entities discussed herein. Santander may provide market commentary or trading strategies to other clients or engage in transactions which may differ from views expressed herein. Santander may have acted upon the contents of this publication prior to you having received it.
This publication is intended for the exclusive use of the recipient and must not be reproduced, redistributed or transmitted, in whole or in part, without Santander’s consent. The recipient agrees to keep confidential at all times information contained herein.


