


The Big Idea
Investing for slower growth and possible recession
Steven Abrahams | June 10, 2022
This material is a Marketing Communication and does not constitute Independent Investment Research.
The Fed this month puts in motion a Great Risk Rotation where Fed holdings roll off and come back to life on other balance sheets. No surprise. The market clearly knows this. But this rotation looks set to happen as the Fed tilts against inflation by aggressively curtailing demand. MBS option-adjusted spreads to the Treasury curve reflect the rotation and have widened and now nearly match the strongest corporate debt, although with much deeper liquidity. The corporate market seems reluctant to fully price the risk to growth. Rotating into MBS from corporate debt on spread alone should seem at least fair value or better. And that’s before looking ahead to the near certainty of slowing growth and possible recession.
The Fed has it out for the economy, or at least for the demand pressures keeping inflation high while the world works through supply frictions brought on by Covid and war. Friday’s inflation surprise has almost certainly put the Fed on a more aggressive path, and forward rates imply fed funds above 3.50% by mid-2023. Consensus among forecasters has year-over-year real GDP growth in the fourth quarter slowing to less than half the pace of the first quarter. If the Fed tightens just enough, slower growth is the end of the story. If the Fed tightens a notch or two too much, growth possibly slips below zero. The consensus chance of recession among forecasters now sits at 30%, still low but high enough to lean into the possibility (Exhibit 1).
Exhibit 1: Still low, but consensus sees a rising risk of recession
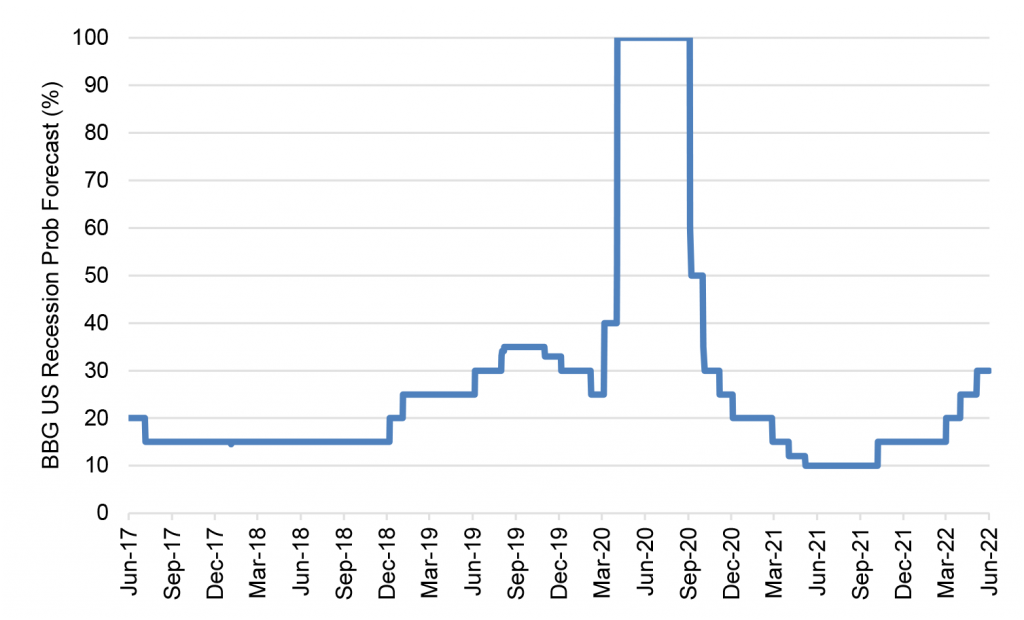
Note: Data shows median Bloomberg surveyed economists’ forecast probability of US recession within one year.
Source: Bloomberg, Amherst Pierpont Securities.
Credit does not like slowing growth or recession. The obvious dominoes fall: slower growth puts a drag on revenue growth, and recession pulls revenues down, squeezing creditors’ ability to service debt. All else equal—ability to manage costs, balance sheet liquidity, debt maturities—corporate default risk rises.
The risks of holding credit through slowdown or recession show in past returns, although the number of cases is low. The US has seen five recessions since the late 1980s. In the six months before recession and through recession, agency MBS on average has broadly matched returns against Treasury debt with the same duration (Exhibit 2). Investment grade corporate debt, on the other hand, has underperformed Treasury debt and agency MBS in the six months before recession by an average of 25 bp and during recession by more than 860 bp. High yield corporate debt has underperformed Treasury debt and MBS in the six months before recession by an average of more than 440 bp and during recession by more than 1619 bp. Corporate credit is a play on growth, and the lower the rating, the more leveraged the exposure.
Exhibit 2: Slowdown and recession historically has hurt credit performance
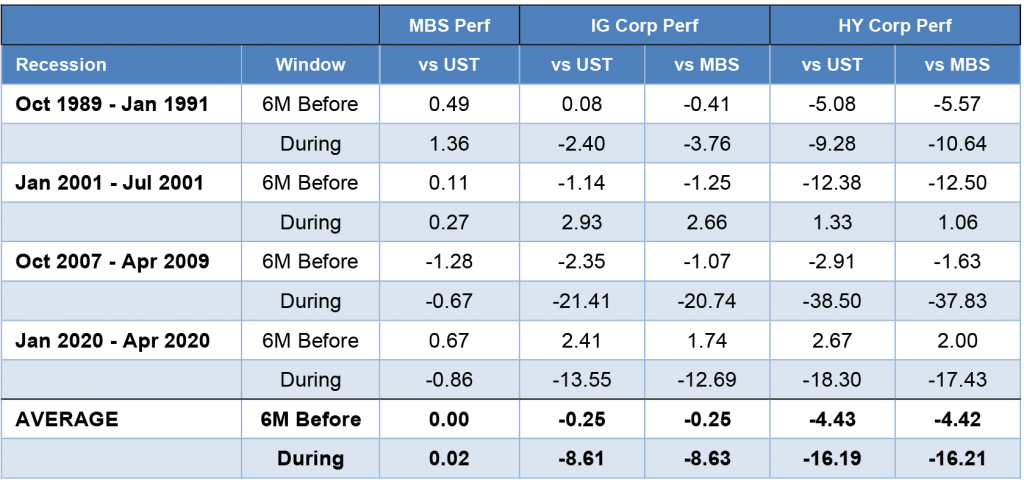
Note: data show cumulative excess returns in percent—total return net of returns on duration-matched Treasury debt—on each asset based on the corresponding Bloomberg/Barclays index. Average is a simple average of the five episodes.
Source: Bloomberg, Amherst Pierpont Securities.
Recent option-adjusted spreads to the Treasury curve on par 30-year MBS have approached their widest point since 2009 save for the months after onset of pandemic. Investors might argue spreads should go even wider if the Fed intends to get out of MBS altogether, although the practical likelihood of complete exit seems low. Even if the Fed left entirely, MBS spreads still should trade tighter than the pre-Fed era on the possibility of future crisis and a Fed return.
MBS also recently has widened to ‘AAA’ corporate debt to the point where OAS between the two is only 10 bp apart—more narrow than in 97% of trading sessions in the last five years (Exhibit 3). Investors can use other cash or CDS benchmarks for corporate spreads, and the pattern of wider MBS relative to corporate debt holds. Benchmarks for corporate debt with lower ratings will show wider absolute spreads than MBS, but higher embedded exposure to slowdown and recession as well. Nothing comes for free.
Exhibit 3: OAS on par 30-year MBS approaches ‘AAA’ corporate spreads
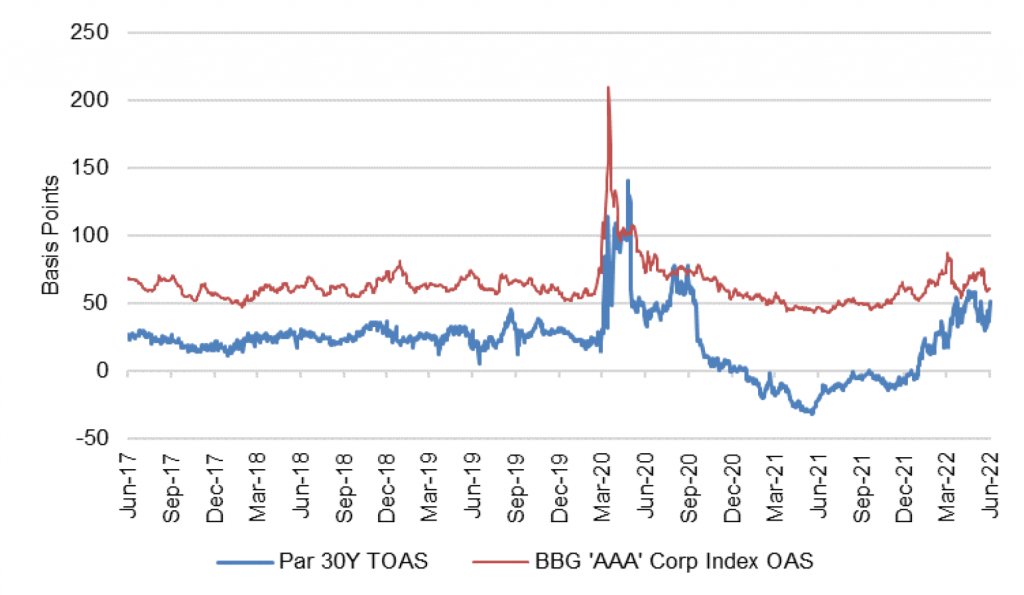
Source: Bloomberg, Amherst Pierpont Securities
Treasury debt does have a liquidity advantage with MBS close behind and corporate debt a distant third. The New York Fed shows average daily trading volume in May for Treasury bills and coupons at $600 billion, for agency MBS at $315 billion and for investment grade corporate notes and bonds at $17 billion. The Treasury market moved 35 times the volume of the investment grade corporate market, and MBS moved 18 times. Volume is only one measure of liquidity, but it aligns with repo margins and other indicators of liquidity. The liquidity difference between Treasury debt and MBS seems modest. But the difference between MBS and corporate debt seems much more material; it takes significantly more time to move a material position in corporate debt. Owning MBS over Treasury debt seems a play on spread with a most loss of liquidity. Owning MBS over corporate debt seems like a play for equal spread but with a compelling gain in liquidity.
Investing based on spread alone can seem unsatisfying since rich assets can get richer and cheap assets can get cheaper. But looking forward, it seems the future for MBS is clearer at this point than for corporate credit. The MBS market has repriced significantly this year to account for the risk of rising rates, the end of QE and possible MBS sales. Uncertainty never vanishes, of course, and MBS net supply from new origination and the form, timing and magnitude of Fed MBS sales still hang out there. But now the corporate market has to weigh growth in the wake of a Fed likely to get increasingly aggressive against inflation.
Current spreads in MBS seem fair to better-than-fair against Treasury debt, and better than fair against credit as the Fed tightens and slows the economy. It takes time to move credit. With the Fed geared to take on inflation, starting to rotate into MBS now seems right.
* * *
The view in rates
Friday’s inflation surprise added fuel to concerns that that the Fed will have to tighten faster and further, and that the yield curve will have to flatten and rates rise. Fair value at 10-year and longer maturities still looks solidly in the neighborhood of 2.50%, but the possibility of a sustained fight with inflation may require compensation above fair value even in long maturities. It looks increasingly likely that 2-year rates will approach 3.5% over the next year and go well above longer rates.
Fed RRP balances closed Friday at $2.16 trillion, a new record. The supply of Treasury bills continues to come down, with bills trading at yields below the RRP’s current and anticipated rate after the June FOMC. Money market funds have little alternative but to put proceeds into RRP.
Settings on 3-month LIBOR have closed Friday at 172 bp. Setting on 3-month term SOFR have drifted up to 155 bp.
The 10-year note has finished the most recent session around 3.15%, getting a sharp lift from the Friday inflation surprise. Breakeven 10-year inflation finished the week at 279 bp, up only 3 bp on the week despite the inflation surprise. The 10-year real rate finished the week at 36 bp, double the level of a week ago. The bounce in real yields implies the market expects a much more aggressive Fed.
The Treasury yield curve has finished its most recent session with 2s10s at 11 bp, 17 bp flatter than a week ago, and 5s30s at -5 bp, 15 bp flatter. Both curves have flattened sharply this week.
The view in spreads
The equilibrium between MBS and credit looks ripe for change. Nominal MBS spreads incorporate big components of the risks that faced the sector at the start of the year—the Fed path, balance sheet normalization, the risk of MBS sales. Credit spreads seem insufficient to cover the spread volatility likely as growth slows and concern about recession grows. The turning point is here, and after nearly two years of better performance in credit, the tide is set to turn toward MBS.
The view in credit
Credit fundamentals look strong for now but will almost certainly soften later this year as the Fed dampens demand and growth begins to slow. In some quarters, the conversation has turned from whether recession will arrive to the shape of recession once it does. Corporations have strong earnings for now, good margins for now, low multiples of debt to gross profits, low debt service and good liquidity. It will be important to watch inflation and see if costs begin to catch up with revenues. A higher real cost of funds would start to eat away at highly leveraged balance sheets with weak or volatile revenues. Consumer balance sheets look strong with rising income, substantial savings and big gains in real estate and investment portfolios. Homeowner equity jumped by $3.5 trillion in 2021, and mortgage delinquencies have dropped to a record low. But inflation and recession could take a toll and add credit risk to consumer balance sheets.