The Big Idea
A consumer puzzle revisited
This material is a Marketing Communication and does not constitute Independent Investment Research.
The run-up in consumer credit earlier this year and the massive piles of unspent cash or equivalents sitting on household balance sheets seemed puzzling. Since then, another month’s consumer credit reading has rolling in and, more importantly, a quarterly update on household balance sheets. The updated data confirm that households are not tapped out but continue to possess vast stores of dry powder as we enter what is likely to be a robust summer for the consumer.
Consumer credit update
The Federal Reserve’s consumer credit data for April showed another noticeable rise in household borrowing. Overall consumer credit rose at a 10.1% annualized pace. However, that figure is not as impressive or alarming as it seems, especially considering that nominal consumer spending increased at an 11.4% annualized pace in the month. In particular, auto sales jumped in April, and the 7.1% annualized rise in nonrevolving debt likely is largely a reflection of more households buying or leasing new vehicles.
Meanwhile, revolving credit, mainly credit cards, posted a 19.6% annualized increase in April. However, as explained in a piece a few weeks ago, the run-up in credit card balances so far this year likely reflects sharply higher purchases, especially for big-ticket items like summer vacation bookings, rather than a sign of stress for the household sector in the aggregate. Keep in mind that if a household doubles the monthly charges on their credit cards in a given month but then pays off the balance in full, the consumer credit series will record roughly a doubling of debt—because it measures average daily balances—even though the household is not carrying debt in the sense that would cause macroeconomic concerns.
Moreover, revolving credit amounts to a relatively small item on household balance sheets. The consumer credit figures show that revolving credit barely exceeds $1 trillion, while nonrevolving credit accounts for close to three-quarters of consumer credit at nearly $3.5 trillion. Moreover, mortgage borrowing, which is not including in the consumer credit figures, is roughly $12 trillion. Meanwhile, household assets totaled $168 trillion in the first quarter, making credit card balances a mere drop in the bucket.
In any case, the level of revolving credit outstanding in April exceeded the 2019 average for the first time since the pandemic. That is, nominal credit card balances are roughly unchanged versus 2019, even as nominal income is up by 16.5% on a comparable basis. This is very far from a sign of stress for the household sector in the aggregate though it is undoubtedly the case that some individual households are likely struggling with excessive debt.
Household liquid assets still rising
The updated data from the Federal Reserve’s quarterly Financial Accounts of the United States debunk the theory that households were spending down their accumulated savings in early 2022. It is true that household net worth fell slightly in the first quarter due to a drop in stock prices. However, household liquid assets continued to increase. The total of bank accounts and money market fund holdings rose by an additional $250 billion in the first quarter to $18.5 trillion (Exhibit 1).
Exhibit 1: Household Liquid Assets
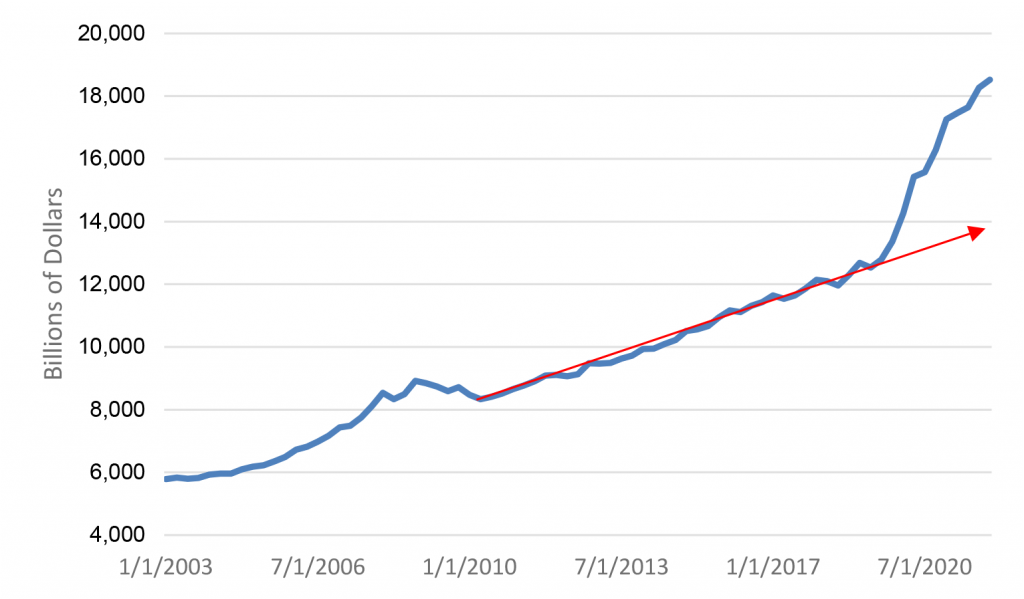
Source: Federal Reserve.
The current level of household liquid assets is at least $4 trillion higher than the pre-pandemic trend line would suggest. That massive extra cushion should help to support consumer spending for years to come and will help to soften the blow to household purchasing power from the sharp acceleration in inflation.
To put the first quarter increase in perspective, the typical annual increase in this measure in the years prior to the pandemic was around $500 billion. Thus, the $250 billion rise in the first quarter indicates that consumers were amassing bank deposits and money market account balances about twice as fast as was the pre-pandemic norm. That is a far cry from the “consumers are burning through their savings” narrative espoused by some analysts.
I would qualify this analysis by noting that the aggregate tally of liquid assets is in nominal terms. I am often asked about how inflation is eating into consumers’ purchasing power. This is a valid concern. To offer some perspective on how inflation is impacting household savings, I would note that the liquid assets aggregate charted above increased at a 5.6% annualized pace in the first quarter while the PCE deflator rose at a 7.0% annualized clip. In real terms, household liquid assets did decline slightly in the first quarter of the year.
To offer an inflation-adjusted read, I deflated the liquid assets series by the PCE deflator (Exhibit 2). The broad conclusions hold. The amount of liquid assets has still risen sharply since the beginning of the pandemic, and the decline in the first quarter was trivial.
Exhibit 2: Real Household Liquid Assets
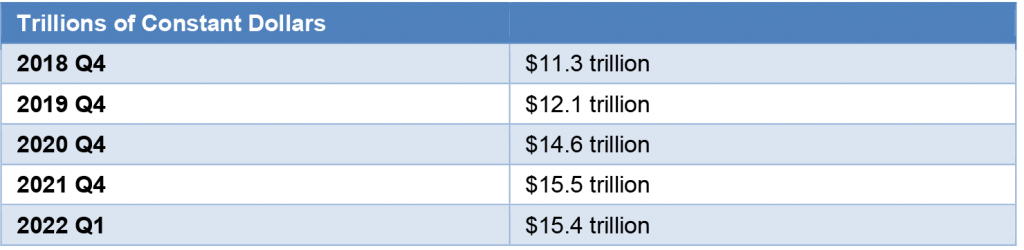
Source: Federal Reserve, BEA.
This material is intended only for institutional investors and does not carry all of the independence and disclosure standards of retail debt research reports. In the preparation of this material, the author may have consulted or otherwise discussed the matters referenced herein with one or more of SCM’s trading desks, any of which may have accumulated or otherwise taken a position, long or short, in any of the financial instruments discussed in or related to this material. Further, SCM may act as a market maker or principal dealer and may have proprietary interests that differ or conflict with the recipient hereof, in connection with any financial instrument discussed in or related to this material.
This message, including any attachments or links contained herein, is subject to important disclaimers, conditions, and disclosures regarding Electronic Communications, which you can find at https://portfolio-strategy.apsec.com/sancap-disclaimers-and-disclosures.
Important Disclaimers
Copyright © 2026 Santander US Capital Markets LLC and its affiliates (“SCM”). All rights reserved. SCM is a member of FINRA and SIPC. This material is intended for limited distribution to institutions only and is not publicly available. Any unauthorized use or disclosure is prohibited.
In making this material available, SCM (i) is not providing any advice to the recipient, including, without limitation, any advice as to investment, legal, accounting, tax and financial matters, (ii) is not acting as an advisor or fiduciary in respect of the recipient, (iii) is not making any predictions or projections and (iv) intends that any recipient to which SCM has provided this material is an “institutional investor” (as defined under applicable law and regulation, including FINRA Rule 4512 and that this material will not be disseminated, in whole or part, to any third party by the recipient.
The author of this material is an economist, desk strategist or trader. In the preparation of this material, the author may have consulted or otherwise discussed the matters referenced herein with one or more of SCM’s trading desks, any of which may have accumulated or otherwise taken a position, long or short, in any of the financial instruments discussed in or related to this material. Further, SCM or any of its affiliates may act as a market maker or principal dealer and may have proprietary interests that differ or conflict with the recipient hereof, in connection with any financial instrument discussed in or related to this material.
This material (i) has been prepared for information purposes only and does not constitute a solicitation or an offer to buy or sell any securities, related investments or other financial instruments, (ii) is neither research, a “research report” as commonly understood under the securities laws and regulations promulgated thereunder nor the product of a research department, (iii) or parts thereof may have been obtained from various sources, the reliability of which has not been verified and cannot be guaranteed by SCM, (iv) should not be reproduced or disclosed to any other person, without SCM’s prior consent and (v) is not intended for distribution in any jurisdiction in which its distribution would be prohibited.
In connection with this material, SCM (i) makes no representation or warranties as to the appropriateness or reliance for use in any transaction or as to the permissibility or legality of any financial instrument in any jurisdiction, (ii) believes the information in this material to be reliable, has not independently verified such information and makes no representation, express or implied, with regard to the accuracy or completeness of such information, (iii) accepts no responsibility or liability as to any reliance placed, or investment decision made, on the basis of such information by the recipient and (iv) does not undertake, and disclaims any duty to undertake, to update or to revise the information contained in this material.
Unless otherwise stated, the views, opinions, forecasts, valuations, or estimates contained in this material are those solely of the author, as of the date of publication of this material, and are subject to change without notice. The recipient of this material should make an independent evaluation of this information and make such other investigations as the recipient considers necessary (including obtaining independent financial advice), before transacting in any financial market or instrument discussed in or related to this material.
Important disclaimers for clients in the EU and UK
This publication has been prepared by Trading Desk Strategists within the Sales and Trading functions of Santander US Capital Markets LLC (“SanCap”), the US registered broker-dealer of Santander Corporate & Investment Banking. This communication is distributed in the EEA by Banco Santander S.A., a credit institution registered in Spain and authorised and regulated by the Bank of Spain and the CNMV. Any EEA recipient of this communication that would like to affect any transaction in any security or issuer discussed herein should do so with Banco Santander S.A. or any of its affiliates (together “Santander”). This communication has been distributed in the UK by Banco Santander, S.A.’s London branch, authorised by the Bank of Spain and subject to regulatory oversight on certain matters by the Financial Conduct Authority (FCA) and the Prudential Regulation Authority (PRA).
The publication is intended for exclusive use for Professional Clients and Eligible Counterparties as defined by MiFID II and is not intended for use by retail customers or for any persons or entities in any jurisdictions or country where such distribution or use would be contrary to local law or regulation.
This material is not a product of Santander´s Research Team and does not constitute independent investment research. This is a marketing communication and may contain ¨investment recommendations¨ as defined by the Market Abuse Regulation 596/2014 ("MAR"). This publication has not been prepared in accordance with legal requirements designed to promote the independence of research and is not subject to any prohibition on dealing ahead of the dissemination of investment research. The author, date and time of the production of this publication are as indicated herein.
This publication does not constitute investment advice and may not be relied upon to form an investment decision, nor should it be construed as any offer to sell or issue or invitation to purchase, acquire or subscribe for any instruments referred herein. The publication has been prepared in good faith and based on information Santander considers reliable as of the date of publication, but Santander does not guarantee or represent, express or implied, that such information is accurate or complete. All estimates, forecasts and opinions are current as at the date of this publication and are subject to change without notice. Unless otherwise indicated, Santander does not intend to update this publication. The views and commentary in this publication may not be objective or independent of the interests of the Trading and Sales functions of Santander, who may be active participants in the markets, investments or strategies referred to herein and/or may receive compensation from investment banking and non-investment banking services from entities mentioned herein. Santander may trade as principal, make a market or hold positions in instruments (or related derivatives) and/or hold financial interest in entities discussed herein. Santander may provide market commentary or trading strategies to other clients or engage in transactions which may differ from views expressed herein. Santander may have acted upon the contents of this publication prior to you having received it.
This publication is intended for the exclusive use of the recipient and must not be reproduced, redistributed or transmitted, in whole or in part, without Santander’s consent. The recipient agrees to keep confidential at all times information contained herein.


