By the Numbers
Rising rates should test sectors of the loan market
This material is a Marketing Communication and does not constitute Independent Investment Research.
Corporate leverage has kept rising for years. But corporate loan performance has remained solid thanks in part to easy monetary policy. As the Fed girds for inflation, the next chapter of the credit book may be different. As rates rise, growth slows and companies’ earnings outlook changes, credit performance should diverge across borrowers in the leveraged loan market. The deviation would be most palpable in the ratios of debt-to-EBITDA and EBITDA-to-interest expense. By those measures, not all industry exposures are equal.
Based on the trailing 12-month data from S&P, debt-to-EBITDA in new loans across different industries mainly ranged between 4.5x to 6.0x while EBITDA-to-interest-expense ranged between 3.8x to 4.5x (Exhibit 1). Television, cable and environmental are outliers in terms of leverage and interest coverage. It is worth noting that the average interest coverage for highly leveraged loans in the first quarter of 2022 is already below many industries’ trailing 12-month average.
Exhibit 1: Issuers of leveraged loans vary widely in, well, leverage
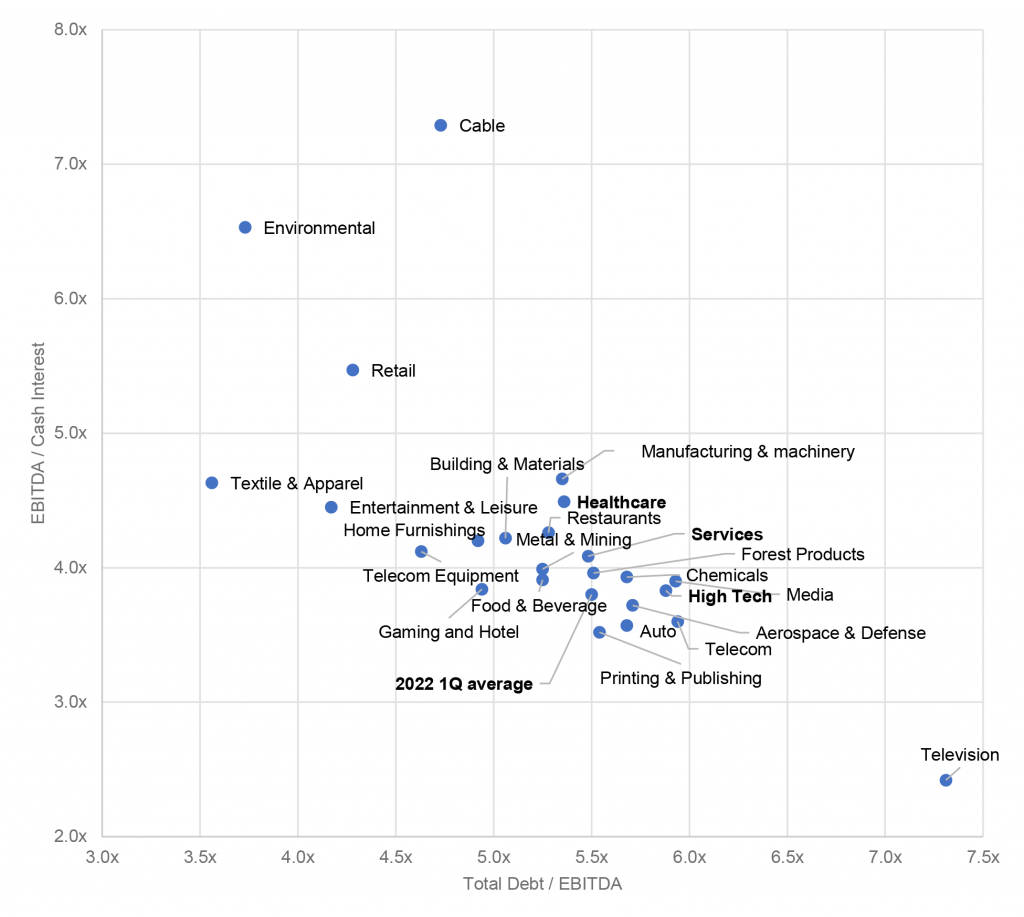
The leverage and interest coverage ratios are trailing twelve-month average of primary market issuance as of April 2022. The Q1 2022 average is for highly leveraged loans with spread at SOFR +225 and higher.
Source: Amherst Pierpont Securities, S&P LCD
CLO and broad investor exposure to these industries varies substantially across the $1.35 trillion loan market with services, high tech and healthcare the largest exposures (Exhibit 2). Among these three, high tech has the most leverage followed by services and then healthcare. Among the next three exposures, media has the highest leverage of any large exposure with chemicals next and manufacturing slightly more leveraged than healthcare.
Exhibit 2: The US leveraged loan market has exposure across industries
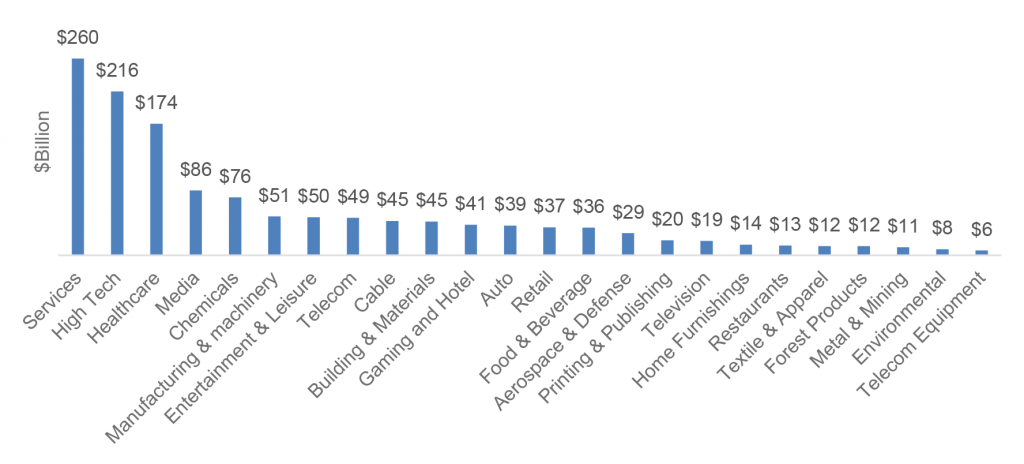
Amount outstanding refers to secondary market first-lien outstandings as of April 2022.
Source: Amherst Pierpont Securities, S&P LCD
The credit spread widening this year has contributed to the rising cost of debt, but an aggressive Fed rate hike plan would further squeeze the interest coverage ratio across all loans to a new low without companies’ earnings growth support.
In a hypothetical scenario where SOFR rises in the next year by 150 bp while EBITDA and loan credit spread stay at their recent trailing 12-month levels, the EBITDA to interest coverage ratio of most industry sectors will drop to 2.5x to 3.0x—quite low by historic standards (Exhibit 3).
Exhibit 3: A 150 bp rise in SOFR would cut interest coverage around 30%

Assume current 3-month SOFR at 1.43%. The average institutional loan credit spreads in trailing twelve months as of April 2022 are used to calculate interest expense.
Source: Amherst Pierpont Securities, S&P LCD
Take healthcare, for example, where the trailing 12-month average EBITDA on new loans as of April was $657.4 million. The total debt-to-EBITDA and EBITDA-to-interest were at 5.4x and 4.5x, respectively. With a 150 bp rise in SOFR, the EBITDA-to-interest ratio will drop to 2.7x (Exhibit 4)
Exhibit 4: A 150 bp rise in SOFR would reduce Interest coverage in healthcare

Source: Amherst Pierpont Securities, S&P LCD
S&P recently reported an EBITDA growth of 15% year-over-year in the first quarter for 160 public filers in the leveraged loan index, but this represents only 13% of the total index. With the broad equity market index down 14% year-to-date, it is optimistic to assume corporate earnings will stay at current levels. The quarter-over-quarter changes may paint a better picture of recent trends. For example, the average EBITDA from the public filers in the healthcare sector in the leveraged loan index had two consecutive quarter-over-quarter declines: -5% in the last quarter of 2021 and -8% in the first quarter of 2022. The average first quarter EBITDA from the public filers in the tech sector also reported a 5% decline. The negative EBITDA trend implies higher leverage on existing debt, potentially impeding efforts to raise new debt.
Rising interest rates should put significant pressure on leveraged balance sheets, raising the risk of downgrade if not default. Earnings, balance sheet liquidity and debt maturities will all play a big part, too. But the leveraged loan market, largely funded with floating-rate debt, will be a bellwether of corporate financial health as the Fed fights inflation. Not far behind will be the performance of CLOs as the main holders of that risk.
This material is intended only for institutional investors and does not carry all of the independence and disclosure standards of retail debt research reports. In the preparation of this material, the author may have consulted or otherwise discussed the matters referenced herein with one or more of SCM’s trading desks, any of which may have accumulated or otherwise taken a position, long or short, in any of the financial instruments discussed in or related to this material. Further, SCM may act as a market maker or principal dealer and may have proprietary interests that differ or conflict with the recipient hereof, in connection with any financial instrument discussed in or related to this material.
This message, including any attachments or links contained herein, is subject to important disclaimers, conditions, and disclosures regarding Electronic Communications, which you can find at https://portfolio-strategy.apsec.com/sancap-disclaimers-and-disclosures.
Important Disclaimers
Copyright © 2026 Santander US Capital Markets LLC and its affiliates (“SCM”). All rights reserved. SCM is a member of FINRA and SIPC. This material is intended for limited distribution to institutions only and is not publicly available. Any unauthorized use or disclosure is prohibited.
In making this material available, SCM (i) is not providing any advice to the recipient, including, without limitation, any advice as to investment, legal, accounting, tax and financial matters, (ii) is not acting as an advisor or fiduciary in respect of the recipient, (iii) is not making any predictions or projections and (iv) intends that any recipient to which SCM has provided this material is an “institutional investor” (as defined under applicable law and regulation, including FINRA Rule 4512 and that this material will not be disseminated, in whole or part, to any third party by the recipient.
The author of this material is an economist, desk strategist or trader. In the preparation of this material, the author may have consulted or otherwise discussed the matters referenced herein with one or more of SCM’s trading desks, any of which may have accumulated or otherwise taken a position, long or short, in any of the financial instruments discussed in or related to this material. Further, SCM or any of its affiliates may act as a market maker or principal dealer and may have proprietary interests that differ or conflict with the recipient hereof, in connection with any financial instrument discussed in or related to this material.
This material (i) has been prepared for information purposes only and does not constitute a solicitation or an offer to buy or sell any securities, related investments or other financial instruments, (ii) is neither research, a “research report” as commonly understood under the securities laws and regulations promulgated thereunder nor the product of a research department, (iii) or parts thereof may have been obtained from various sources, the reliability of which has not been verified and cannot be guaranteed by SCM, (iv) should not be reproduced or disclosed to any other person, without SCM’s prior consent and (v) is not intended for distribution in any jurisdiction in which its distribution would be prohibited.
In connection with this material, SCM (i) makes no representation or warranties as to the appropriateness or reliance for use in any transaction or as to the permissibility or legality of any financial instrument in any jurisdiction, (ii) believes the information in this material to be reliable, has not independently verified such information and makes no representation, express or implied, with regard to the accuracy or completeness of such information, (iii) accepts no responsibility or liability as to any reliance placed, or investment decision made, on the basis of such information by the recipient and (iv) does not undertake, and disclaims any duty to undertake, to update or to revise the information contained in this material.
Unless otherwise stated, the views, opinions, forecasts, valuations, or estimates contained in this material are those solely of the author, as of the date of publication of this material, and are subject to change without notice. The recipient of this material should make an independent evaluation of this information and make such other investigations as the recipient considers necessary (including obtaining independent financial advice), before transacting in any financial market or instrument discussed in or related to this material.
Important disclaimers for clients in the EU and UK
This publication has been prepared by Trading Desk Strategists within the Sales and Trading functions of Santander US Capital Markets LLC (“SanCap”), the US registered broker-dealer of Santander Corporate & Investment Banking. This communication is distributed in the EEA by Banco Santander S.A., a credit institution registered in Spain and authorised and regulated by the Bank of Spain and the CNMV. Any EEA recipient of this communication that would like to affect any transaction in any security or issuer discussed herein should do so with Banco Santander S.A. or any of its affiliates (together “Santander”). This communication has been distributed in the UK by Banco Santander, S.A.’s London branch, authorised by the Bank of Spain and subject to regulatory oversight on certain matters by the Financial Conduct Authority (FCA) and the Prudential Regulation Authority (PRA).
The publication is intended for exclusive use for Professional Clients and Eligible Counterparties as defined by MiFID II and is not intended for use by retail customers or for any persons or entities in any jurisdictions or country where such distribution or use would be contrary to local law or regulation.
This material is not a product of Santander´s Research Team and does not constitute independent investment research. This is a marketing communication and may contain ¨investment recommendations¨ as defined by the Market Abuse Regulation 596/2014 ("MAR"). This publication has not been prepared in accordance with legal requirements designed to promote the independence of research and is not subject to any prohibition on dealing ahead of the dissemination of investment research. The author, date and time of the production of this publication are as indicated herein.
This publication does not constitute investment advice and may not be relied upon to form an investment decision, nor should it be construed as any offer to sell or issue or invitation to purchase, acquire or subscribe for any instruments referred herein. The publication has been prepared in good faith and based on information Santander considers reliable as of the date of publication, but Santander does not guarantee or represent, express or implied, that such information is accurate or complete. All estimates, forecasts and opinions are current as at the date of this publication and are subject to change without notice. Unless otherwise indicated, Santander does not intend to update this publication. The views and commentary in this publication may not be objective or independent of the interests of the Trading and Sales functions of Santander, who may be active participants in the markets, investments or strategies referred to herein and/or may receive compensation from investment banking and non-investment banking services from entities mentioned herein. Santander may trade as principal, make a market or hold positions in instruments (or related derivatives) and/or hold financial interest in entities discussed herein. Santander may provide market commentary or trading strategies to other clients or engage in transactions which may differ from views expressed herein. Santander may have acted upon the contents of this publication prior to you having received it.
This publication is intended for the exclusive use of the recipient and must not be reproduced, redistributed or transmitted, in whole or in part, without Santander’s consent. The recipient agrees to keep confidential at all times information contained herein.


