The Long and Short
IG finally posts a positive return in May
This material is a Marketing Communication and does not constitute Independent Investment Research.
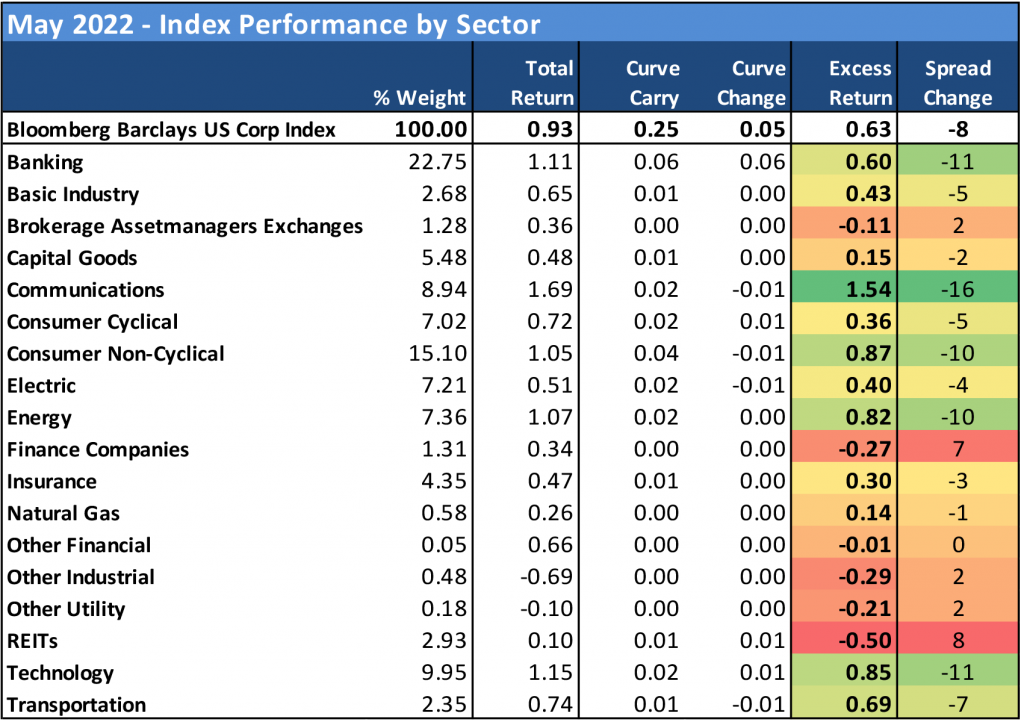
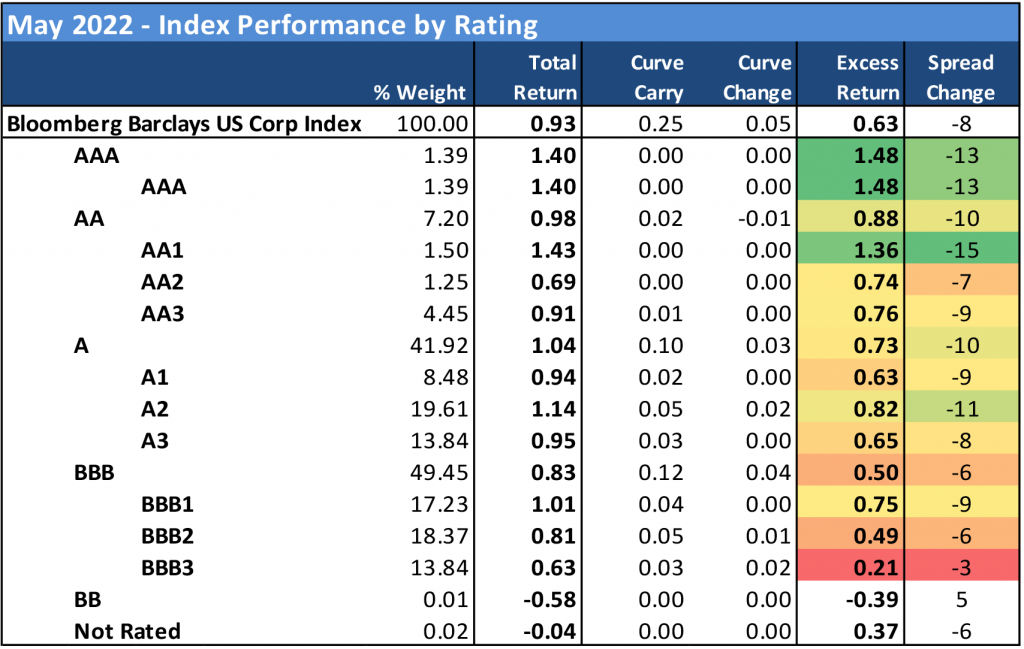
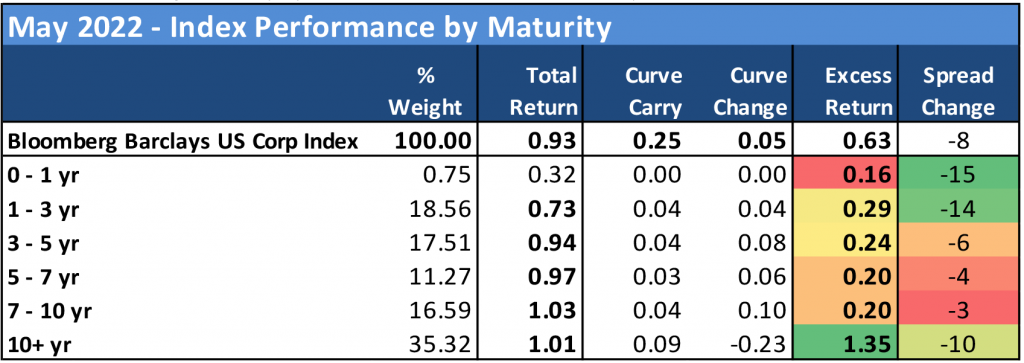
The investment grade corporate bond index posted its first positive total return of the year in May, as rates fell modestly and credit tightened off a local wide. Despite more than $20 billion in outflows from US investment grade bond funds, spreads on the IG index managed to tighten by 8 bp in what appeared to be a very distinct flight-to-quality in credit. It was enough to generate a 0.93% total return and 0.63% excess return for May, despite continued selling in the first three weeks of the month.
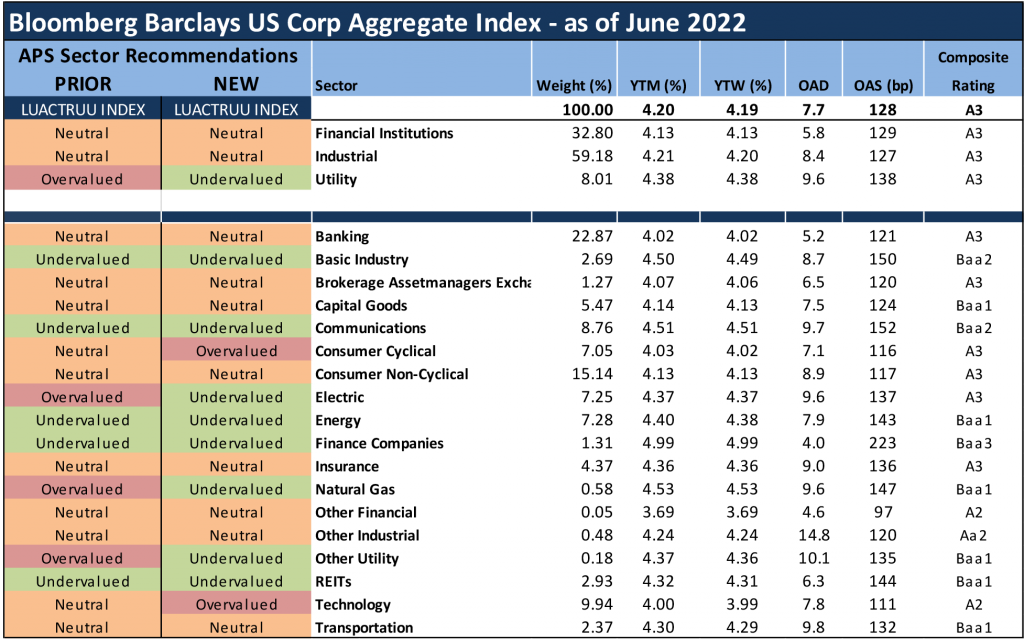
Off the May performance, Amherst Pierpont is making a few changes to sector relative value views. Utilities and natural gas segments move to undervalued from overvalued, while technology and consumer-cyclical segments move to overvalued. The two graphics below provide a summary of Amherst Pierpont expected excess return across sectors—total return net of Treasury hedges—within the IG Index for the next several months. These suggestions serve as a proxy for how portfolio managers should position their holdings relative to the broad IG corporate bond market. The relative value recommendations consider a 6-month horizon.
Exhibit 1 and 2. APS Sector Recommendations for June 2022
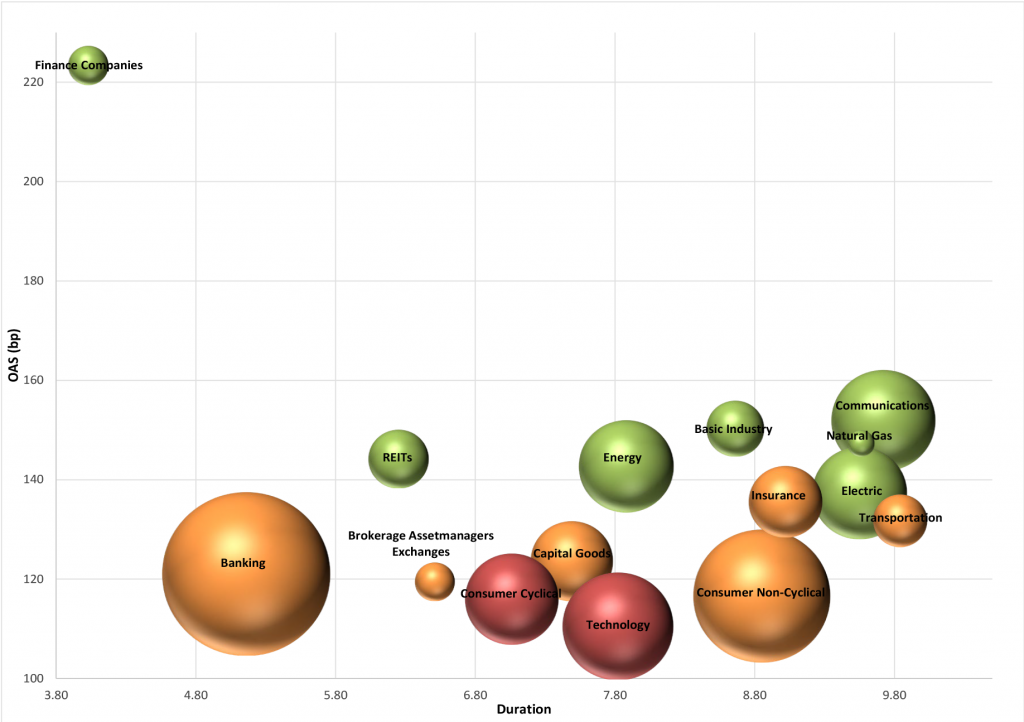
Source: Amherst Pierpont, Bloomberg/Barclays US Corp Index
Color = recommendation: Green – undervalued, Red – overvalued, Yellow – neutral
Size = Market Value within the IG Index
With the current pace of inflation not seeming to slow anytime soon, retailers must look at further price hikes to offset the spike in energy and transportation costs while managing wages. Recent wage increases have hit margins and if inflation continues at the current pace, further wage increases may be necessary in order to retain employees. This will likely lead to further margin deterioration as the year progresses and the possibility of more downward revisions to guidance. After the risk-off trade witnessed with the latest round of retail earnings, we felt it was necessary to deem the consumer cyclical sector as overvalued.
Despite being flush with cash, technology companies that rely heavily on M&A for growth will be forced to pay more if financing their acquisitions with debt. The use of equity as currency seems unlikely given that the Nasdaq is down nearly 23% year to date. Additionally, supply chain constraints have exacerbated chip shortages which means that meaningful top line and profit growth is unlikely to come to fruition this year. The weakness in the equity market has leaned on credit spreads in this sector, despite the majority of technology balance sheets being very much in shape. As such, we believe the sector remains overvalued and likely to witness further widening as the year progresses and interest rates rise.
Source: Amherst Pierpont, Bloomberg/Barclays US Corp Index
In May, safer credits were favored by investors in the credit recovery. As a result, the top performing sectors were communications (1.54% excess return), consumer non-cyclical (0.87%), technology (0.85%), utilities (0.82%), and transportation. The top performance in the communications sector was aided by the AT&T tender offer that took place during May with the proceeds from the recent WarnerMedia spin-off debt launch back in March. Higher risk segments of the market struggled to participate in the recovery, as investors maintained their distance from higher beta credits that have experienced the worst of the recent sell-off. In particular, finance companies (-0.27%)—with concentrations in middle-market direct lenders and aircraft finance companies—continued to significantly underperform the broader IG market. Also among the bottom performances in May were REITs (-0.50%), brokers/asset managers (-0.11), natural gas (0.14%) and capital goods (0.15%).
The USD investment grade new issue calendar moderately underperformed expectations in May with $93.5 billion in total volume for the month, but with frequent delays and postponements from issuers the final total seems like it could have been a lot worse – particularly given that the final week of the month was a total washout. Issuers were persistent on days that new issue was functioning. There were just three jumbo debt launches contributing to the monthly total, led by Intercontinental Exchange’s (ICE: A3/A-) $8 billion debt launch to fund a merger announcement from just days earlier. Issuers are not waiting around to bring their merger funding packages to the market given all the trepidation around rates and the trajectory of credit. Better to issue today with special mandatory redemption language than wait around and risk much higher borrowing costs, or worse yet a new issue calendar that cannot accommodate your issuance needs. High yield primary markets were nearly non-existent adding just $5.0 billion to May’s total gross supply. Banks made up the bulk of the primary calendar at over 40% while the ICE deal pushed broker/asset managers to nearly 13% of the IG calendar.
Exhibit 3. Gross and Net Supply Recap
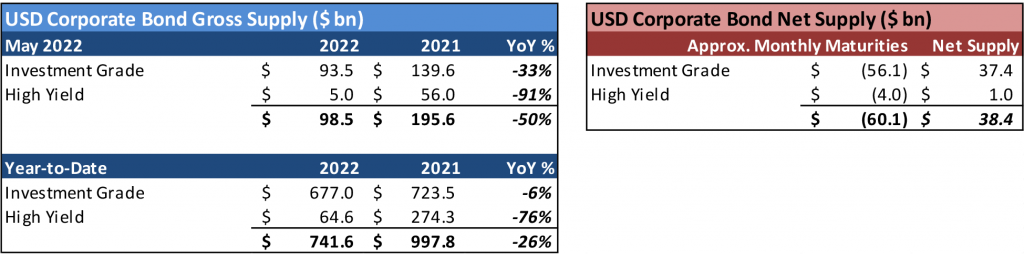
Source: Bloomberg LP, LEAG Tables, new debt and maturity SRCH
Exhibit 4. Mutual Fund Flows
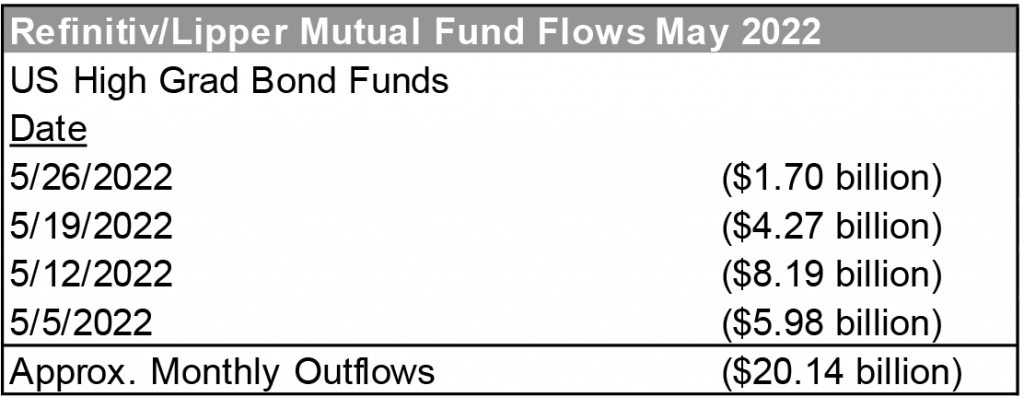
Source: Bloomberg LP, Refinitiv/Lipper weekly flow data
Exhibit 5. New Issue by Sector
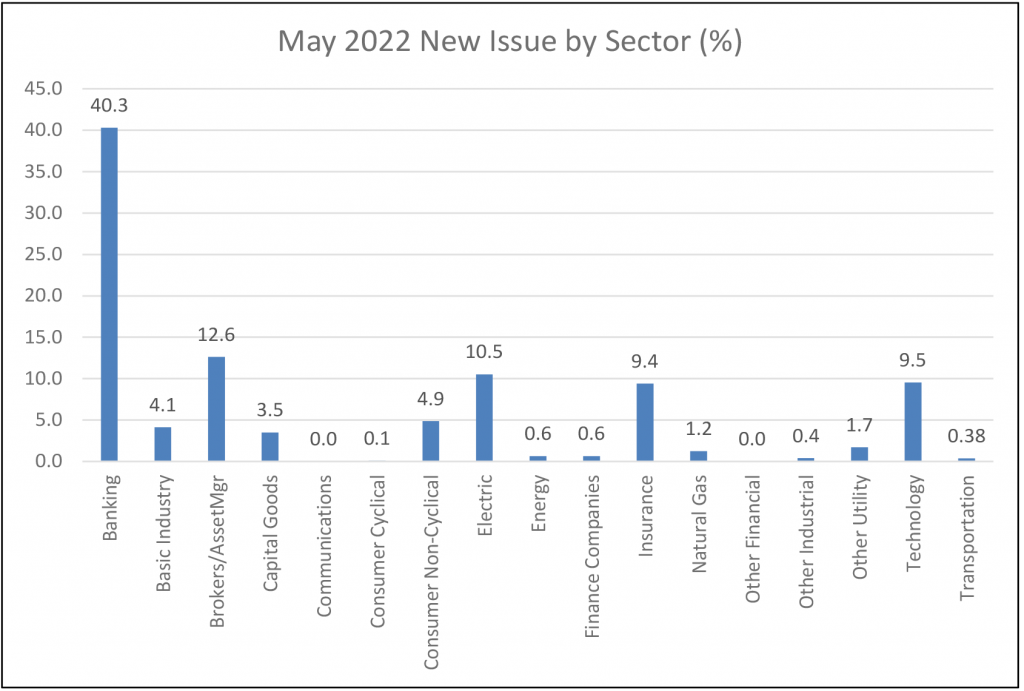
Source: Bloomberg LP, LEAG Tables, new debt and maturity SRCH
Exhibit 6. New Issue by Rating
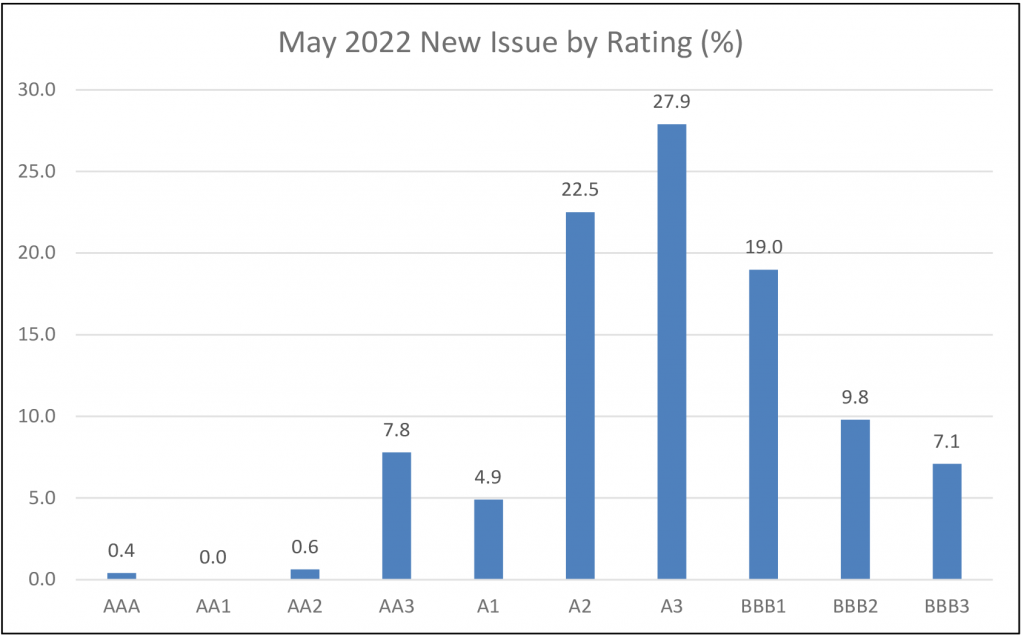
Source: Bloomberg LP, LEAG Tables, new debt and maturity SRCH
Exhibit 7. New Issue by Tenor
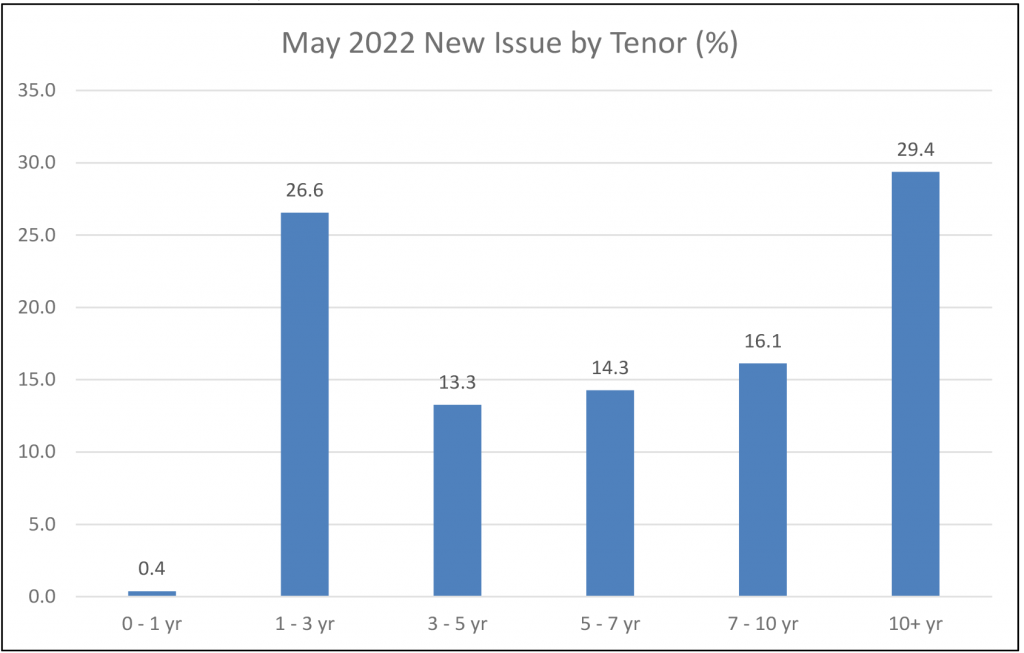
Source: Bloomberg LP, LEAG Tables, new debt and maturity SRCH
Exhibit 8. Flight to quality favors communications, consumer, tech, and utilities
Source: Bloomberg Barclays US Corp Index
Exhibit 9. The late month recovery in credit was very much a flight to quality
Source: Bloomberg Barclays US Corp Index
Exhibit 10. Long-dated paper benefits as treasuries rally off the wides
Source: Bloomberg Barclays US Corp Index
Exhibit 11. KSS spreads continue to spike on takeover speculation, business development companies (BDCs) continue to be among the bottom performers

Source: Bloomberg Barclays US Corp Index
This material is intended only for institutional investors and does not carry all of the independence and disclosure standards of retail debt research reports. In the preparation of this material, the author may have consulted or otherwise discussed the matters referenced herein with one or more of SCM’s trading desks, any of which may have accumulated or otherwise taken a position, long or short, in any of the financial instruments discussed in or related to this material. Further, SCM may act as a market maker or principal dealer and may have proprietary interests that differ or conflict with the recipient hereof, in connection with any financial instrument discussed in or related to this material.
This message, including any attachments or links contained herein, is subject to important disclaimers, conditions, and disclosures regarding Electronic Communications, which you can find at https://portfolio-strategy.apsec.com/sancap-disclaimers-and-disclosures.
Important Disclaimers
Copyright © 2026 Santander US Capital Markets LLC and its affiliates (“SCM”). All rights reserved. SCM is a member of FINRA and SIPC. This material is intended for limited distribution to institutions only and is not publicly available. Any unauthorized use or disclosure is prohibited.
In making this material available, SCM (i) is not providing any advice to the recipient, including, without limitation, any advice as to investment, legal, accounting, tax and financial matters, (ii) is not acting as an advisor or fiduciary in respect of the recipient, (iii) is not making any predictions or projections and (iv) intends that any recipient to which SCM has provided this material is an “institutional investor” (as defined under applicable law and regulation, including FINRA Rule 4512 and that this material will not be disseminated, in whole or part, to any third party by the recipient.
The author of this material is an economist, desk strategist or trader. In the preparation of this material, the author may have consulted or otherwise discussed the matters referenced herein with one or more of SCM’s trading desks, any of which may have accumulated or otherwise taken a position, long or short, in any of the financial instruments discussed in or related to this material. Further, SCM or any of its affiliates may act as a market maker or principal dealer and may have proprietary interests that differ or conflict with the recipient hereof, in connection with any financial instrument discussed in or related to this material.
This material (i) has been prepared for information purposes only and does not constitute a solicitation or an offer to buy or sell any securities, related investments or other financial instruments, (ii) is neither research, a “research report” as commonly understood under the securities laws and regulations promulgated thereunder nor the product of a research department, (iii) or parts thereof may have been obtained from various sources, the reliability of which has not been verified and cannot be guaranteed by SCM, (iv) should not be reproduced or disclosed to any other person, without SCM’s prior consent and (v) is not intended for distribution in any jurisdiction in which its distribution would be prohibited.
In connection with this material, SCM (i) makes no representation or warranties as to the appropriateness or reliance for use in any transaction or as to the permissibility or legality of any financial instrument in any jurisdiction, (ii) believes the information in this material to be reliable, has not independently verified such information and makes no representation, express or implied, with regard to the accuracy or completeness of such information, (iii) accepts no responsibility or liability as to any reliance placed, or investment decision made, on the basis of such information by the recipient and (iv) does not undertake, and disclaims any duty to undertake, to update or to revise the information contained in this material.
Unless otherwise stated, the views, opinions, forecasts, valuations, or estimates contained in this material are those solely of the author, as of the date of publication of this material, and are subject to change without notice. The recipient of this material should make an independent evaluation of this information and make such other investigations as the recipient considers necessary (including obtaining independent financial advice), before transacting in any financial market or instrument discussed in or related to this material.
Important disclaimers for clients in the EU and UK
This publication has been prepared by Trading Desk Strategists within the Sales and Trading functions of Santander US Capital Markets LLC (“SanCap”), the US registered broker-dealer of Santander Corporate & Investment Banking. This communication is distributed in the EEA by Banco Santander S.A., a credit institution registered in Spain and authorised and regulated by the Bank of Spain and the CNMV. Any EEA recipient of this communication that would like to affect any transaction in any security or issuer discussed herein should do so with Banco Santander S.A. or any of its affiliates (together “Santander”). This communication has been distributed in the UK by Banco Santander, S.A.’s London branch, authorised by the Bank of Spain and subject to regulatory oversight on certain matters by the Financial Conduct Authority (FCA) and the Prudential Regulation Authority (PRA).
The publication is intended for exclusive use for Professional Clients and Eligible Counterparties as defined by MiFID II and is not intended for use by retail customers or for any persons or entities in any jurisdictions or country where such distribution or use would be contrary to local law or regulation.
This material is not a product of Santander´s Research Team and does not constitute independent investment research. This is a marketing communication and may contain ¨investment recommendations¨ as defined by the Market Abuse Regulation 596/2014 ("MAR"). This publication has not been prepared in accordance with legal requirements designed to promote the independence of research and is not subject to any prohibition on dealing ahead of the dissemination of investment research. The author, date and time of the production of this publication are as indicated herein.
This publication does not constitute investment advice and may not be relied upon to form an investment decision, nor should it be construed as any offer to sell or issue or invitation to purchase, acquire or subscribe for any instruments referred herein. The publication has been prepared in good faith and based on information Santander considers reliable as of the date of publication, but Santander does not guarantee or represent, express or implied, that such information is accurate or complete. All estimates, forecasts and opinions are current as at the date of this publication and are subject to change without notice. Unless otherwise indicated, Santander does not intend to update this publication. The views and commentary in this publication may not be objective or independent of the interests of the Trading and Sales functions of Santander, who may be active participants in the markets, investments or strategies referred to herein and/or may receive compensation from investment banking and non-investment banking services from entities mentioned herein. Santander may trade as principal, make a market or hold positions in instruments (or related derivatives) and/or hold financial interest in entities discussed herein. Santander may provide market commentary or trading strategies to other clients or engage in transactions which may differ from views expressed herein. Santander may have acted upon the contents of this publication prior to you having received it.
This publication is intended for the exclusive use of the recipient and must not be reproduced, redistributed or transmitted, in whole or in part, without Santander’s consent. The recipient agrees to keep confidential at all times information contained herein.


