By the Numbers
A timely entry point in short ‘AAA’ CLOs
This material is a Marketing Communication and does not constitute Independent Investment Research.
The median credit spread for ‘AAA’ CLOs in the secondary market has widened from 130 bp at the beginning of the year to 200 bp recently. And the term curve in ‘AAA’ CLOs has become flat with short ‘AAA’ CLOs lately trading at mostly the same spreads as their long peers. Shorter ‘AAA’ CLOs typically offer more spread than long CLOs for each year of weighted average life, but the spread advantage has become particularly pronounced in recent weeks. It is a good entry point for investors managing short-duration fixed income portfolios.
The exact reason for the pronounced widening in short ‘AAA’ CLOs is hard to pin down. Spreads have moved wider throughout the year across the CLO term curve (Exhibit 1). Some of the widening may be in sympathy with competing investments. Some of it may reflect a significant rise in CLO bid list volume. And although fundamental credit performance is good, the bid list volume could reflect investors trying to get ahead of any credit issues created by higher rates and slower eventual growth. Some investors may have decided to sell CLOs with the highest dollar price because price upside is limited and the investor need to raise cash, possibly in anticipation of future redemptions.
Exhibit 1. Spread compensation is roughly flat across CLO weighted average lives
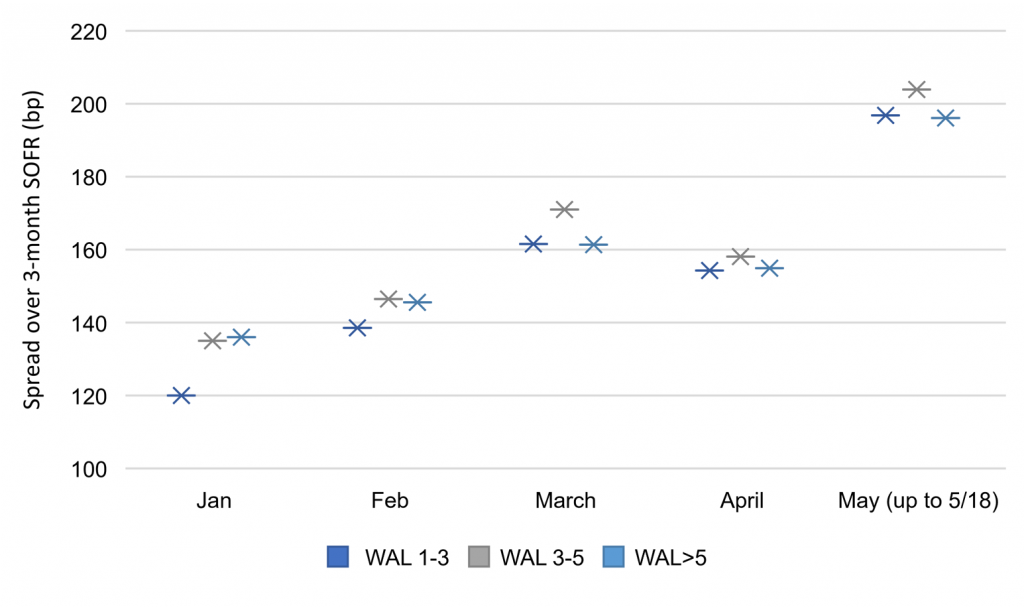
Note: Only traded bonds with pricing talk color and cover bid price are used to derive the spread level. 20 CPR, 2CDR, 70% severity for cash flow run in INTEX. The median spread levels for all traded positions are used in the chart.
Source: Kopen technologies, INTEX, Amherst Pierpont Securities
The flattening of the term curve in ‘AAA’ CLOs started in March with the median of 1- to 3-year WAL ‘AAA’ CLOs and 5-year and longer ‘AAA’ CLOs both at 161 bp. The trend has continued in April and May.
Borrowing from the Sherman ratio concept in the corporate bond market, which divides bond yields over the duration to measure return to taking interest rate risk, calculating the credit spread for each unit of WAL is one way to gauge the spread sensitivity in different CLO buckets. CLOs are floating-rate instruments that are largely shielded from the rising interest rate risk, but credit spread widening will cause the bond price to drop and ultimately erode investors’ returns earned from coupon. For example, the median WAL for all traded ‘AAA’ bonds in the 1- to 3-year WAL bucket in May is 1.9 years and the median spread over 3-month SOFR for the same group is 197 bp. The spread per unit of WAL for short ‘AAA’ CLOs, at 104 bp, is three times higher than the spread for CLOs having WAL over 5 years (Exhibit 2). This leaves the long WAL ‘AAA’ CLOs more vulnerable to credit spread widening.
Exhibit 2. Short ‘AAA’ CLOs offers higher WAL adjusted spreads
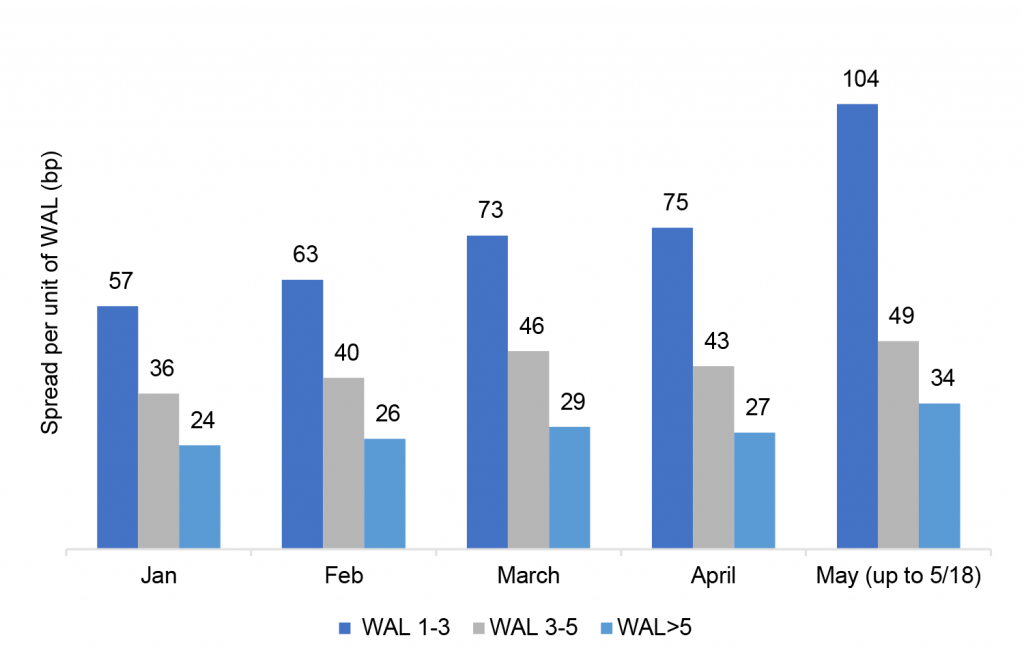
Note: Only traded bonds with pricing talk color and cover bid price are used to derive the spread level. 20 CPR, 2CDR, 70% severity for cashflow run in INTEX. The median spread levels and WAL for all traded positions are used in the chart.
Source: Kopen technologies, INTEX, Amherst Pierpont Securities
From a CLO structure perspective, the call risk differs for bonds in different WAL buckets. Unlike other fixed-income assets, CLO call risk is sensitive to credit spread movement instead of rate movement. Most short ‘AAA’ CLOs are currently passed the non-call period and the reinvestment period or about to reach the end of the reinvestment period. By contrast, the long WAL CLOs are in the non-call period and have years remaining until the end of the reinvestment period. The callability of the shorter CLOs might explain some of the wider spread per unit WAL. However, a shorter reinvestment period should work in the opposite direction, tightening spreads. In a risk-off environment like today, any potential widening of credit spreads should make the call protection less valuable. Instead, investors should benefit more from allocating to seasoned vintages with low spread duration and low call protection.
The recent widening of ‘AAA’ CLOs spreads in secondary provides good opportunity for fixed income managers, especially those with short-duration mandates. Not only are the ‘AAA’ CLOs spreads at wide levels compared to ‘AAA’ corporate debt, but the CLOs offered in secondary also trade wider than the primary market. The ‘AAA’ CLO index total return has outperformed the short-duration Bloomberg/Barclays US Corporate Index most of the time in the last decade when the 10-year US Treasury yield moved up by 80 bp or more (Exhibit 3). As of May 18, the ‘AAA’ CLO index has outperformed the short-duration 1- to 3-year corporate index by 190 bp and the 1- to 5-year corporate index by 387 bp (Exhibit 3).
Exhibit 3. ‘AAA’ CLO index total return outperformed in most rising rates environment
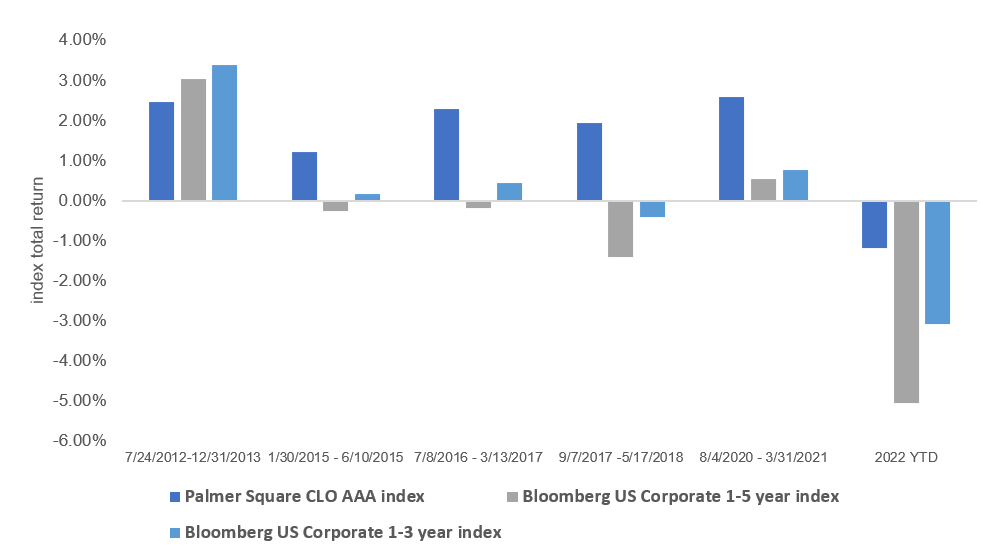
Note: current w.a. life of CLO ‘AAA’ tranches in the Palmer index is 3.8. The Bloomberg US corporate 1-3 year index OAD is 1.87. The Bloomberg US corporate 1-5 year index OAD is 2.71.
Source: Bloomberg, Amherst Pierpont Securities
This material is intended only for institutional investors and does not carry all of the independence and disclosure standards of retail debt research reports. In the preparation of this material, the author may have consulted or otherwise discussed the matters referenced herein with one or more of SCM’s trading desks, any of which may have accumulated or otherwise taken a position, long or short, in any of the financial instruments discussed in or related to this material. Further, SCM may act as a market maker or principal dealer and may have proprietary interests that differ or conflict with the recipient hereof, in connection with any financial instrument discussed in or related to this material.
This message, including any attachments or links contained herein, is subject to important disclaimers, conditions, and disclosures regarding Electronic Communications, which you can find at https://portfolio-strategy.apsec.com/sancap-disclaimers-and-disclosures.
Important Disclaimers
Copyright © 2026 Santander US Capital Markets LLC and its affiliates (“SCM”). All rights reserved. SCM is a member of FINRA and SIPC. This material is intended for limited distribution to institutions only and is not publicly available. Any unauthorized use or disclosure is prohibited.
In making this material available, SCM (i) is not providing any advice to the recipient, including, without limitation, any advice as to investment, legal, accounting, tax and financial matters, (ii) is not acting as an advisor or fiduciary in respect of the recipient, (iii) is not making any predictions or projections and (iv) intends that any recipient to which SCM has provided this material is an “institutional investor” (as defined under applicable law and regulation, including FINRA Rule 4512 and that this material will not be disseminated, in whole or part, to any third party by the recipient.
The author of this material is an economist, desk strategist or trader. In the preparation of this material, the author may have consulted or otherwise discussed the matters referenced herein with one or more of SCM’s trading desks, any of which may have accumulated or otherwise taken a position, long or short, in any of the financial instruments discussed in or related to this material. Further, SCM or any of its affiliates may act as a market maker or principal dealer and may have proprietary interests that differ or conflict with the recipient hereof, in connection with any financial instrument discussed in or related to this material.
This material (i) has been prepared for information purposes only and does not constitute a solicitation or an offer to buy or sell any securities, related investments or other financial instruments, (ii) is neither research, a “research report” as commonly understood under the securities laws and regulations promulgated thereunder nor the product of a research department, (iii) or parts thereof may have been obtained from various sources, the reliability of which has not been verified and cannot be guaranteed by SCM, (iv) should not be reproduced or disclosed to any other person, without SCM’s prior consent and (v) is not intended for distribution in any jurisdiction in which its distribution would be prohibited.
In connection with this material, SCM (i) makes no representation or warranties as to the appropriateness or reliance for use in any transaction or as to the permissibility or legality of any financial instrument in any jurisdiction, (ii) believes the information in this material to be reliable, has not independently verified such information and makes no representation, express or implied, with regard to the accuracy or completeness of such information, (iii) accepts no responsibility or liability as to any reliance placed, or investment decision made, on the basis of such information by the recipient and (iv) does not undertake, and disclaims any duty to undertake, to update or to revise the information contained in this material.
Unless otherwise stated, the views, opinions, forecasts, valuations, or estimates contained in this material are those solely of the author, as of the date of publication of this material, and are subject to change without notice. The recipient of this material should make an independent evaluation of this information and make such other investigations as the recipient considers necessary (including obtaining independent financial advice), before transacting in any financial market or instrument discussed in or related to this material.
Important disclaimers for clients in the EU and UK
This publication has been prepared by Trading Desk Strategists within the Sales and Trading functions of Santander US Capital Markets LLC (“SanCap”), the US registered broker-dealer of Santander Corporate & Investment Banking. This communication is distributed in the EEA by Banco Santander S.A., a credit institution registered in Spain and authorised and regulated by the Bank of Spain and the CNMV. Any EEA recipient of this communication that would like to affect any transaction in any security or issuer discussed herein should do so with Banco Santander S.A. or any of its affiliates (together “Santander”). This communication has been distributed in the UK by Banco Santander, S.A.’s London branch, authorised by the Bank of Spain and subject to regulatory oversight on certain matters by the Financial Conduct Authority (FCA) and the Prudential Regulation Authority (PRA).
The publication is intended for exclusive use for Professional Clients and Eligible Counterparties as defined by MiFID II and is not intended for use by retail customers or for any persons or entities in any jurisdictions or country where such distribution or use would be contrary to local law or regulation.
This material is not a product of Santander´s Research Team and does not constitute independent investment research. This is a marketing communication and may contain ¨investment recommendations¨ as defined by the Market Abuse Regulation 596/2014 ("MAR"). This publication has not been prepared in accordance with legal requirements designed to promote the independence of research and is not subject to any prohibition on dealing ahead of the dissemination of investment research. The author, date and time of the production of this publication are as indicated herein.
This publication does not constitute investment advice and may not be relied upon to form an investment decision, nor should it be construed as any offer to sell or issue or invitation to purchase, acquire or subscribe for any instruments referred herein. The publication has been prepared in good faith and based on information Santander considers reliable as of the date of publication, but Santander does not guarantee or represent, express or implied, that such information is accurate or complete. All estimates, forecasts and opinions are current as at the date of this publication and are subject to change without notice. Unless otherwise indicated, Santander does not intend to update this publication. The views and commentary in this publication may not be objective or independent of the interests of the Trading and Sales functions of Santander, who may be active participants in the markets, investments or strategies referred to herein and/or may receive compensation from investment banking and non-investment banking services from entities mentioned herein. Santander may trade as principal, make a market or hold positions in instruments (or related derivatives) and/or hold financial interest in entities discussed herein. Santander may provide market commentary or trading strategies to other clients or engage in transactions which may differ from views expressed herein. Santander may have acted upon the contents of this publication prior to you having received it.
This publication is intended for the exclusive use of the recipient and must not be reproduced, redistributed or transmitted, in whole or in part, without Santander’s consent. The recipient agrees to keep confidential at all times information contained herein.


