


By the Numbers
Larger loans counter higher rates, lifting net supply
Brian Landy, CFA | May 13, 2022
This document is intended for institutional investors and is not subject to all of the independence and disclosure standards applicable to debt research reports prepared for retail investors. This material does not constitute research.
The agency MBS market has seen heavy net supply for the last two years, a consequence of a strong housing market. But mortgage rates since the start of January have jumped to 5.30%, a 221 bp increase. Higher mortgage rates make homes less affordable, and the net supply of new agency MBS is closely linked to home sales. Slower housing normally should cause supply to fall, but the size of new loans now flowing into agency MBS is much larger than just a couple of years ago. The flow of larger loans should offset much of the impact of higher rates and keep net supply well above pre-pandemic levels.
Agency MBS net supply increased significantly during the pandemic. In 2019 net supply averaged $18.4 billion a month, increased in 2020 to $42.2 billion a month and jumped in 2021 to $72.4 billion a month. Much of this increase can be explained by three factors:
- A pickup in new home sales, which jumped 29% in 2020 but slowed 7.7% in 2021 due to constrained supply
- A pickup in existing home sales, which increased 19.5% in 2020 but slowed 6.7% in 2021
- A jump in home prices, which drove up the average size of a new loan; new agency purchase loan in 2019 had an average balance of $255,000, for example, but this increased to $284,000 in 2020 and $311,000 in 2021
The contribution to net supply from existing home sales should be related to the difference between the average balance of a new purchase loan compared to the average balance of the loan it replaces. That spread can be approximated by comparing the average balance of new purchase loans in agency pools to the average balance of loans that prepaid when those loans were originated. In 2019, the average new purchase loan was $50,000 larger than loans that prepaid around the time of purchase. That difference in 2021 jumped to $90,000. And it has widened even more so far in 2022 to $111,000.
Loans in agency pools cannot exceed certain loan sizes, which are adjusted annually by the Federal Housing Finance Agency. The baseline national limit is called the conforming loan limit, although larger loans are allowed from certain high-cost areas. The limit is linked to home price appreciation, but on a lag. The 2022 conforming limit is based on home price appreciation from September 2020 through September 2021. The size of loans put in agency pools consequently jumped this year. Appreciation has also been robust since September 2021, pointing to a potential jump in the conforming limit next year.
A model that relies on those three factors suggests that monthly net supply is unlikely to fall back to pre-pandemic levels (Exhibit 1). The left side of the graph shows historical monthly net supply from 2018 through March 2022, while the right side shows net supply forecasts. The light blue line shows the model’s historical predictions on the left-side of the graph, and on the right-side projects monthly net supply assuming home sales and loan sizes remain the same as in 2021.
Exhibit 1. Monthly net supply should remain higher than pre-pandemic levels
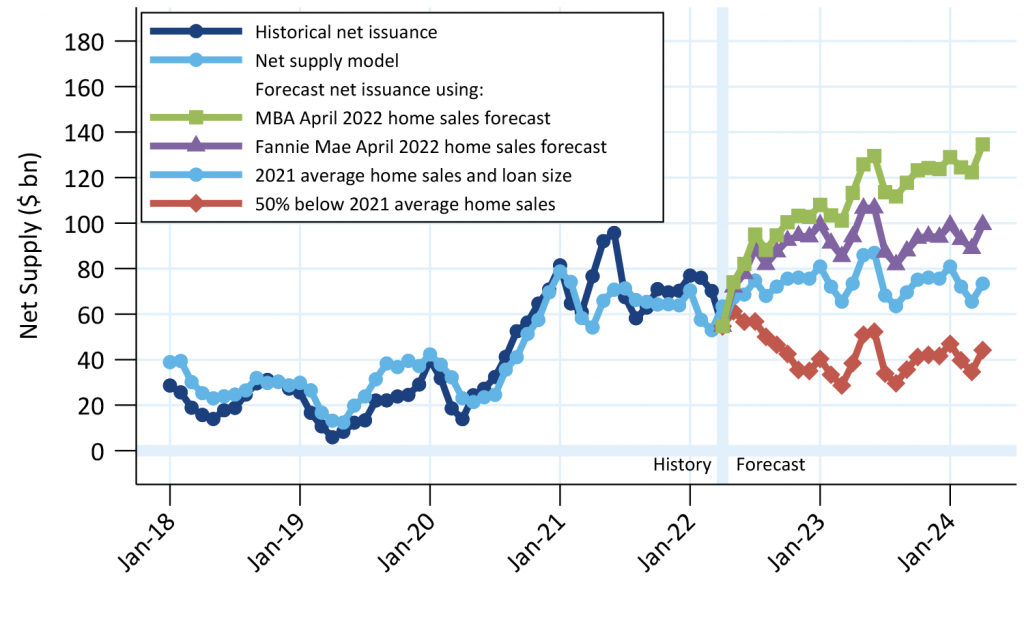
Note: A 3-month moving average is applied to all series.
Source: Fannie Mae, Freddie Mac, Ginnie Mae, Amherst Pierpont Securities
The heaviest supply scenario is based on the MBA’s most recent home sales forecast. The MBA forecasts existing home sales to be close to unchanged from 2021 to 2022, then increasing in 2023 and 2024. New home sales are projected to increase annually from 2022 through 2024. Loan sizes are also expected to increase in 2022 and subsequent years. These aggressive assumptions suggest net supply would ramp up to $100 billion a month on average by the end of the year and reach $120 billion per month by the start of 2024.
Fannie Mae’s most recent forecast is more conservative, possibly because it was updated later in April, when rates were higher, than the MBA’s forecast. This forecast projects existing home sales to fall in 2022 and again in 2023. New home sales will increase slightly in 2022 before falling in 2023. But those decreases are not enough to pull projected supply lower.
The red line is the lowest and shows what would happen if home sales dropped by 50%. MBS net supply would fall to roughly $40 billion a month. The larger projected loan sizes in 2022 and beyond prevent supply from falling to, or below, pre-pandemic levels. This suggests that net supply should remain well above historical levels, barring a catastrophic decline in home purchase activity and prices.
There are other factors that can influence agency MBS net supply that are not captured by the model. Loans could go into private-label securities. The rate for a non-conforming jumbo loan is currently move than 45 bp lower than for a conforming loan, so private-label execution may look more attractive than usual. This could also encourage banks to keep loans on their balance sheets. At other times, borrowers may replace private financing with a conventional loan. The pace of FHA-to-conventional refinancing may also have picked up, since FHA borrowers whose homes have appreciated a lot can stop paying mortgage insurance by refinancing into a conventional loan. Cash-out refinances also contribute to net supply. However, purchase activity should be the dominant factor, and indicates that net supply will remain elevated unless there is a large drop in both purchase activity and home prices.