The Big Idea
Brace for impact
This material is a Marketing Communication and does not constitute Independent Investment Research.
The notion of financial conditions seems a little abstract on most days, but not so much lately. Rates are higher, equities lower, credit spreads wider and volatility up. Markets in Treasury debt, MBS and credit have thinned, become more prone to gaps in pricing. Some issuers have backed away from the market. Credit has become more expensive and harder to get. Conditions have clearly tightened, and quickly. If history is a guide, the market has priced for a hard landing.
Measures of financial conditions have sprung up from a handful of providers in the decade since Dodd Frank set up the Financial Stability Oversight Council. Goldman Sachs, Bloomberg, the federal Office of Financial Research and the Kansas City Fed each offer one. The Chicago Fed offers two. Some report daily, some weekly, some monthly. All combine some measures of rate and credit spreads and volatility. Some include equity performance. All of these measures have reflected tighter financial conditions as the Fed has rolled into its latest hiking cycle.
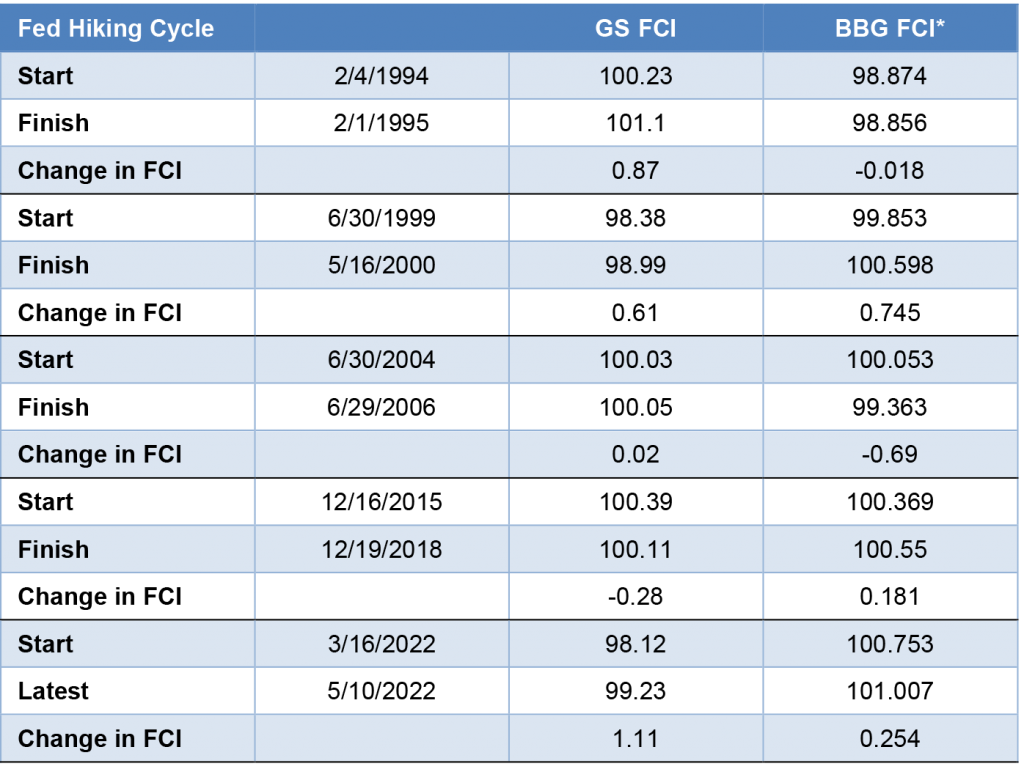
Tightening conditions through a Fed hiking cycle echo not the Fed of the 2000s or 2010s but instead the Fed of the 1990s. Both the Goldman Sachs Financial Conditions Index and the Bloomberg Financial Conditions Index, adjusted so a reading of 100 reflects neutral, have long histories and report daily. In the two hiking cycles of the 1990s—from 1994 to 1995 and from 1999 to 2000—the average of these indices showed financial conditions generally tightened from start to finish (Exhibit 1). After each cycle, the Fed quickly reversed course, suggesting policy had tightened too much. But in the hiking cycle from 2004 to 2006, the average of the measures showed conditions eased. And in the cycle from 2015 to 2018, the average of the measures shows conditions ended up flat. Goldilocks would have like the Fed of the 2000s and 2010s.
Exhibit 1: Financial conditions have tightened unusually fast as Fed hikes begin
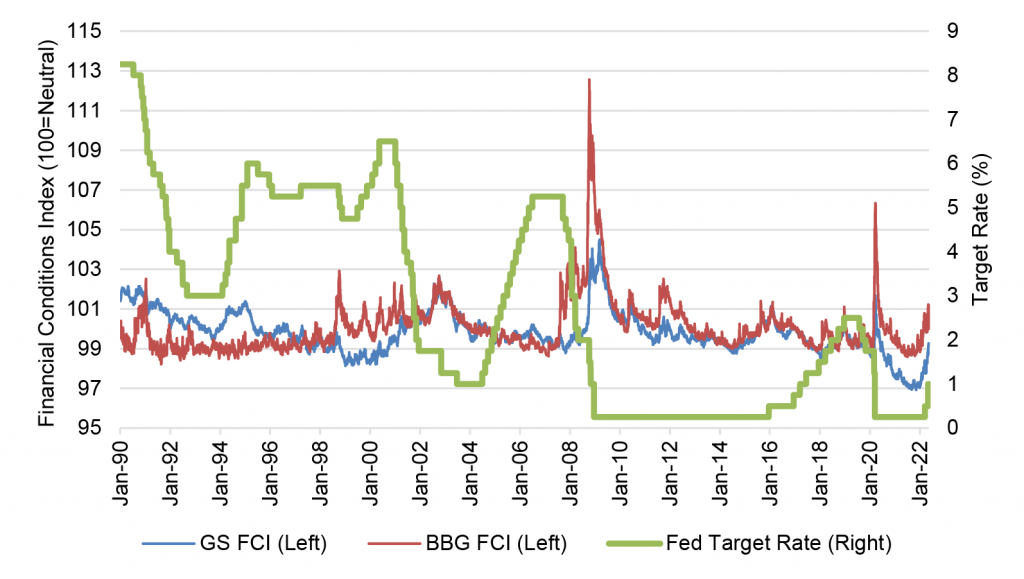
Note: Bloomberg FCI adjusted to have a base of 100 to make it comparable to the Goldman Sachs FCI.
Source: Bloomberg, Amherst Pierpont Securities
From the Fed’s first hike this year on March 16 and running through May 10, the average of the two financial conditions indices is up more than any other hiking cycle since the 1990s. Even though Fed policy is still easy by almost any measure, the market has priced in aggressively higher fed funds rates and a long course of balance sheet normalization, and it has revalued equity, widened credit and MBS spreads and kept implied and actual volatility relatively high. Measures of financial conditions reflect all of this.
The messaging between the Fed and the market can sometimes seem like a hall of mirrors, with the Fed both guiding the market and then reading the market to help calibrate policy. Little in Fed messaging suggests for now that the market has it wrong, at least for the implied forward path of policy rates reflected in fed fund futures, OIS or the Treasury curve. But the market has to look beyond foreseeable fed funds to their impact on longer rates, credit and other markets. The sharp tightening of financial conditions suggests the market is pricing for a slowdown in growth, if not recession, and a potential quick reversal of Fed policy after this hiking cycle ends. That certainly would be consistent with the 1990s.
The wildcard is the Fed’s reaction to the market’s message. Fed Chair Powell clearly wants to bring inflation down without damage to growth or employment. But the market is not giving that to him right now. The market expects the Fed to take the blunt instrument of fed funds hikes and stamp out inflation. Eggs and other things may be cracked. Powell seems to be looking at a choice between forging ahead against inflation or accommodating a market that may bring on a hard landing through its own repricing and tightening of conditions. Given that choice, Powell and others at the Fed seem resolute: inflation gets the nod.
* * *
The view in rates
Yields have reversed course lately and dropped, with room on the long end to drop further. Fair value at 10-year and longer maturities still look solidly in the neighborhood of 2.50%, but market implied 10-year inflation remains high. The curve still should invert significantly over the next year with 2-year rates approaching 3.5%. Persistent supply and trade frictions from Russia-Ukraine could force the Fed to go higher than currently priced and push the 2-year note well above current forward rates.
The Fed’s RRP balances closed Friday at $1.86 trillion, flat week-over-week. The supply of Treasury bills continues to come down, and money market funds have little alternative but to put proceeds into RRP.
Settings on 3-month LIBOR have closed Friday at 141 bp, up 4 bp in the last week. Setting on 3-month SOFR have drifted up to 124 bp, up 6 bp in the last week.
The 10-year note has finished the most recent session at 2.92%, down 21 bp in a week. Breakeven 10-year inflation finished the week at 274 bp, down 12 bp on the week. The 10-year real rate finished the week at 19 bp, down 9 bp on the week. Real 10-year rates only recently have turned positive since the start of pandemic.
The Treasury yield curve has finished its most recent session with 2s10s at 34 bp, 5 bp flatter on the week, and 5s30s at 21 bp, steeper by 6 bp on the week.
The view in spreads
Spreads still look broadly biased to widen in both MBS and credit. Nominal MBS spreads will probably have to trade wider than the average investment grade corporate issue before it becomes compelling relative value for total return investors. Of the major spread markets, corporate and structured credit is likely to outperform, as it has generally since March 2020. Corporates benefit from strong corporate fundamentals and from buyers not tied to Fed policy—especially insurers. The credit markets have a diversified base of buyers while the only net buyers of MBS during pandemic have been the Fed and banks.
The view in credit
Credit fundamentals look strong for now but will almost certainly soften later this year as the Fed dampens demand and growth begins to slow. Corporations have strong earnings, good margins, low multiples of debt to gross profits, low debt service and good liquidity. It will be important to watch inflation and see if costs begin to catch up with revenues. A higher real cost of funds would start to eat away at highly leveraged balance sheets with weak or volatile revenues. Consumer balance sheets look strong with rising income, substantial savings and big gains in real estate and investment portfolios. Homeowner equity jumped by $3.5 trillion in 2021, and mortgage delinquencies have dropped to a record low.
This material is intended only for institutional investors and does not carry all of the independence and disclosure standards of retail debt research reports. In the preparation of this material, the author may have consulted or otherwise discussed the matters referenced herein with one or more of SCM’s trading desks, any of which may have accumulated or otherwise taken a position, long or short, in any of the financial instruments discussed in or related to this material. Further, SCM may act as a market maker or principal dealer and may have proprietary interests that differ or conflict with the recipient hereof, in connection with any financial instrument discussed in or related to this material.
This message, including any attachments or links contained herein, is subject to important disclaimers, conditions, and disclosures regarding Electronic Communications, which you can find at https://portfolio-strategy.apsec.com/sancap-disclaimers-and-disclosures.
Important Disclaimers
Copyright © 2026 Santander US Capital Markets LLC and its affiliates (“SCM”). All rights reserved. SCM is a member of FINRA and SIPC. This material is intended for limited distribution to institutions only and is not publicly available. Any unauthorized use or disclosure is prohibited.
In making this material available, SCM (i) is not providing any advice to the recipient, including, without limitation, any advice as to investment, legal, accounting, tax and financial matters, (ii) is not acting as an advisor or fiduciary in respect of the recipient, (iii) is not making any predictions or projections and (iv) intends that any recipient to which SCM has provided this material is an “institutional investor” (as defined under applicable law and regulation, including FINRA Rule 4512 and that this material will not be disseminated, in whole or part, to any third party by the recipient.
The author of this material is an economist, desk strategist or trader. In the preparation of this material, the author may have consulted or otherwise discussed the matters referenced herein with one or more of SCM’s trading desks, any of which may have accumulated or otherwise taken a position, long or short, in any of the financial instruments discussed in or related to this material. Further, SCM or any of its affiliates may act as a market maker or principal dealer and may have proprietary interests that differ or conflict with the recipient hereof, in connection with any financial instrument discussed in or related to this material.
This material (i) has been prepared for information purposes only and does not constitute a solicitation or an offer to buy or sell any securities, related investments or other financial instruments, (ii) is neither research, a “research report” as commonly understood under the securities laws and regulations promulgated thereunder nor the product of a research department, (iii) or parts thereof may have been obtained from various sources, the reliability of which has not been verified and cannot be guaranteed by SCM, (iv) should not be reproduced or disclosed to any other person, without SCM’s prior consent and (v) is not intended for distribution in any jurisdiction in which its distribution would be prohibited.
In connection with this material, SCM (i) makes no representation or warranties as to the appropriateness or reliance for use in any transaction or as to the permissibility or legality of any financial instrument in any jurisdiction, (ii) believes the information in this material to be reliable, has not independently verified such information and makes no representation, express or implied, with regard to the accuracy or completeness of such information, (iii) accepts no responsibility or liability as to any reliance placed, or investment decision made, on the basis of such information by the recipient and (iv) does not undertake, and disclaims any duty to undertake, to update or to revise the information contained in this material.
Unless otherwise stated, the views, opinions, forecasts, valuations, or estimates contained in this material are those solely of the author, as of the date of publication of this material, and are subject to change without notice. The recipient of this material should make an independent evaluation of this information and make such other investigations as the recipient considers necessary (including obtaining independent financial advice), before transacting in any financial market or instrument discussed in or related to this material.
Important disclaimers for clients in the EU and UK
This publication has been prepared by Trading Desk Strategists within the Sales and Trading functions of Santander US Capital Markets LLC (“SanCap”), the US registered broker-dealer of Santander Corporate & Investment Banking. This communication is distributed in the EEA by Banco Santander S.A., a credit institution registered in Spain and authorised and regulated by the Bank of Spain and the CNMV. Any EEA recipient of this communication that would like to affect any transaction in any security or issuer discussed herein should do so with Banco Santander S.A. or any of its affiliates (together “Santander”). This communication has been distributed in the UK by Banco Santander, S.A.’s London branch, authorised by the Bank of Spain and subject to regulatory oversight on certain matters by the Financial Conduct Authority (FCA) and the Prudential Regulation Authority (PRA).
The publication is intended for exclusive use for Professional Clients and Eligible Counterparties as defined by MiFID II and is not intended for use by retail customers or for any persons or entities in any jurisdictions or country where such distribution or use would be contrary to local law or regulation.
This material is not a product of Santander´s Research Team and does not constitute independent investment research. This is a marketing communication and may contain ¨investment recommendations¨ as defined by the Market Abuse Regulation 596/2014 ("MAR"). This publication has not been prepared in accordance with legal requirements designed to promote the independence of research and is not subject to any prohibition on dealing ahead of the dissemination of investment research. The author, date and time of the production of this publication are as indicated herein.
This publication does not constitute investment advice and may not be relied upon to form an investment decision, nor should it be construed as any offer to sell or issue or invitation to purchase, acquire or subscribe for any instruments referred herein. The publication has been prepared in good faith and based on information Santander considers reliable as of the date of publication, but Santander does not guarantee or represent, express or implied, that such information is accurate or complete. All estimates, forecasts and opinions are current as at the date of this publication and are subject to change without notice. Unless otherwise indicated, Santander does not intend to update this publication. The views and commentary in this publication may not be objective or independent of the interests of the Trading and Sales functions of Santander, who may be active participants in the markets, investments or strategies referred to herein and/or may receive compensation from investment banking and non-investment banking services from entities mentioned herein. Santander may trade as principal, make a market or hold positions in instruments (or related derivatives) and/or hold financial interest in entities discussed herein. Santander may provide market commentary or trading strategies to other clients or engage in transactions which may differ from views expressed herein. Santander may have acted upon the contents of this publication prior to you having received it.
This publication is intended for the exclusive use of the recipient and must not be reproduced, redistributed or transmitted, in whole or in part, without Santander’s consent. The recipient agrees to keep confidential at all times information contained herein.


