By the Numbers
Relative value across the CMBS floater landscape
This material is a Marketing Communication and does not constitute Independent Investment Research.
Volatile markets and an aggressive Fed have increased investor interest in CMBS floaters. There are a wide range of choices in discount margins and weighted average lives. But one important consideration is the underlying benchmark: backward-looking 30-day compound average SOFR, which is used by Freddie KF deals and most CRE CLOs, or forward-looking 1-month term SOFR, which has become the standard in SASB deals. The spread difference between the two is currently 45 bp. And although discount margins have been widening along with the market since late 2021, there are signs of stability.
Freddie Mac began issuing floating-rate classes benchmarked to compound average SOFR in late 2019. CRE CLOs and SASB floating-rate deals did not fully switch to SOFR-benchmarked issues until this year. The switch to SOFR has been a little bit bumpy, but it’s easier now to compare relative value across the three main CMBS floater categories:
- Freddie KF AS classes,
- AAA-rated CRE CLOs (A and AS classes), and
- AAA-rated SASB A classes.
Freddie Mac floating-rate loans can have a final maturity of 5-, 7- or 10-years although most are 7- and 10-year finals. The loans tend to prepay on average at about 33 months, and the deals show a weighted average life between 3 and 4 years. Multifamily borrowers have often used these floating-rate loans to fix and flip properties, as the typical structure is for the loan to have a 2-year lockout period followed by a prepayment penalty of 1%. A complete discussion can be found in Parsing fast prepayments in Freddie K floaters.
Exhibit 1: Freddie Mac KF discount margins may still be widening
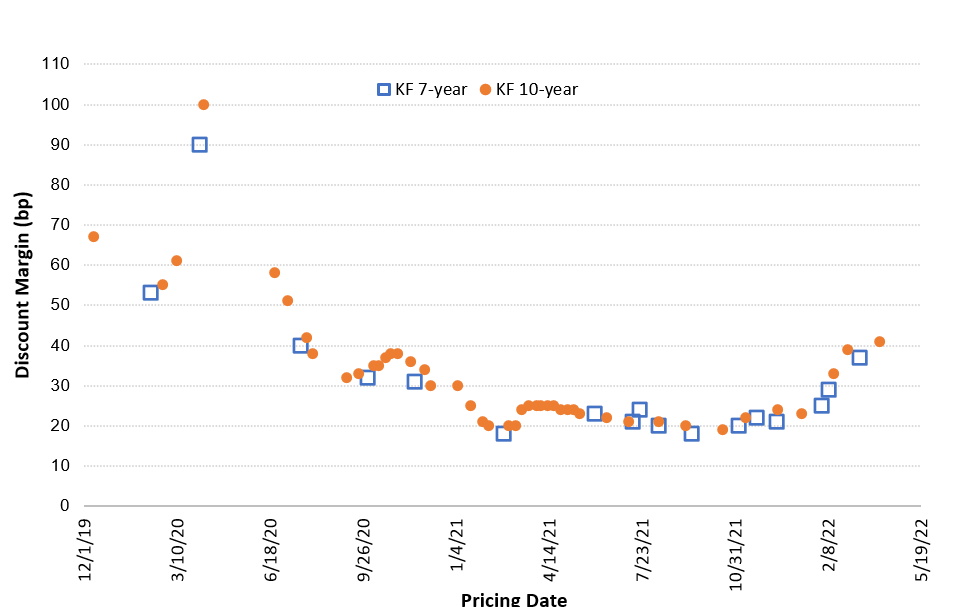
Note: All margins are for the AS class where the underlying index is 30-day compounded average of overnight SOFR (SOFR30A on Bloomberg).
Source: Bloomberg, Amherst Pierpont Santander
Discount margins on new issue KF deals maintained a low of about 20 bp through most of 2021 and began rising late in the fourth quarter. So far, spreads have steadily widened to about 40 bp in 2022 with another deal expected to price the first week of May. These spreads are still below their pre-pandemic levels of 50 to 60 bp.
Exhibit 2: CRECLO AAA floater margins appear to have stabilized
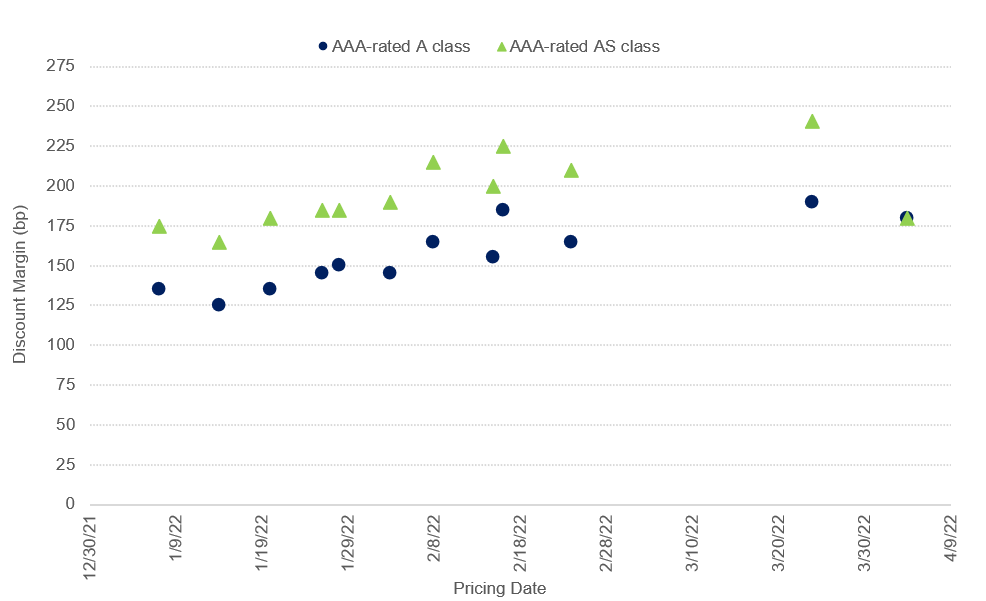
Note: Most of these CRE CLO classes are indexed to 30-day compounded average SOFR, though a few use 1-month term SOFR (TSFR1M on Bloomberg) as the floating rate index.
Source: Bloomberg, Amherst Pierpont Santander
CRE CLO AAA-rated floaters have shorter WAL and wider spreads than KF loans
CRE CLO collateral has a 5-year final maturity, compared to most 7- and 10-year Freddie K loans. Loans in CRE CLOs are typically both prepayable and have extension options. A 2-year loan may have three 1-year extension options, and a 3-year loan may have two 1-year extensions. This means there can be a significant amount of duration drift across the classes. The A class has a shorter WAL than the AS since they pay down sequentially. The A classes of these CRE CLOs have an original WAL of 2.75 years at issuance on average. The AS classes are slightly longer with an original WAL of 3.32 years on average. With extensions a CRE CLO can have a similar WAL as a Freddie KF deal of 3 to 4 years, though in most cases without the additional extension risk beyond 5 years. It’s technically possible in some managed CRE CLO deals for the manager to allow a loan to extend beyond 5 years, but it’s unusual.
In theory and in some circumstances in practice, there should be no difference between floaters indexed to backward-looking versus forward-looking SOFR. The BDS 2022-FL11 deal priced an ATS class indexed to forward-looking, 1-month term SOFR and an ACS class indexed to backward-looking, 30-day compound average SOFR. Both classes were priced with a discount margin of 180 bp on 4/4/2022 (Exhibit 2, overlapping points on the right hand side of the chart). However, that was in early April when the spread between the two indices was 15 bp. More investors appear to be requesting classes indexed to forward-looking SOFR, and some are migrating to SASB floaters where that is already the standard.
SASB AAA-rated floaters have shortest WAL, wide margin range
The original WAL of the AAA-rated A class of single asset, single borrower (SASB) averages just under 2 years. This is the shortest average WAL profile of CMBS floaters. Most SASB A class floaters have a shorter WAL and similar margins to CRE CLO A class floaters (Exhibit 3). SASB spreads appear to have shown a bit more stability overall in 2022 than CRE CLOs or Freddie Ks, but that is offset by the wide margin range across credits. Industrial and multifamily properties tend to price and trade tighter than retail and office properties, reflecting greater strength in those sectors.
Even in the AAA tranche, discount margins are somewhat sensitive to the property type and credit profile of the underlying asset. For example, four recent deals that priced during the first week of April had discount margins ranging from 164 bp to 309 bp at pricing (Exhibit 3). Given the recent market volatility, none of these deals priced at par. For example. the NCMS 2022-JERI A class had a floating rate of 1-month term SOFR + 140 bp, but priced at 97.08, resulting in a discount margin of 309 bp to original WAL (1.74 years).
In the reverse of CRE CLOs, most SASB floaters are indexed to forward-looking 1-month term SOFR. One exception was the JPMCC 2022-ACB deal, priced March 9, which issued it’s A class indexed to SOFR30A. This makes SASB floaters more attractive than CRE CLO floaters indexed to term SOFR in a rising rate environment.
Exhibit 3: SASB AAA-rated floater margins are very credit sensitive
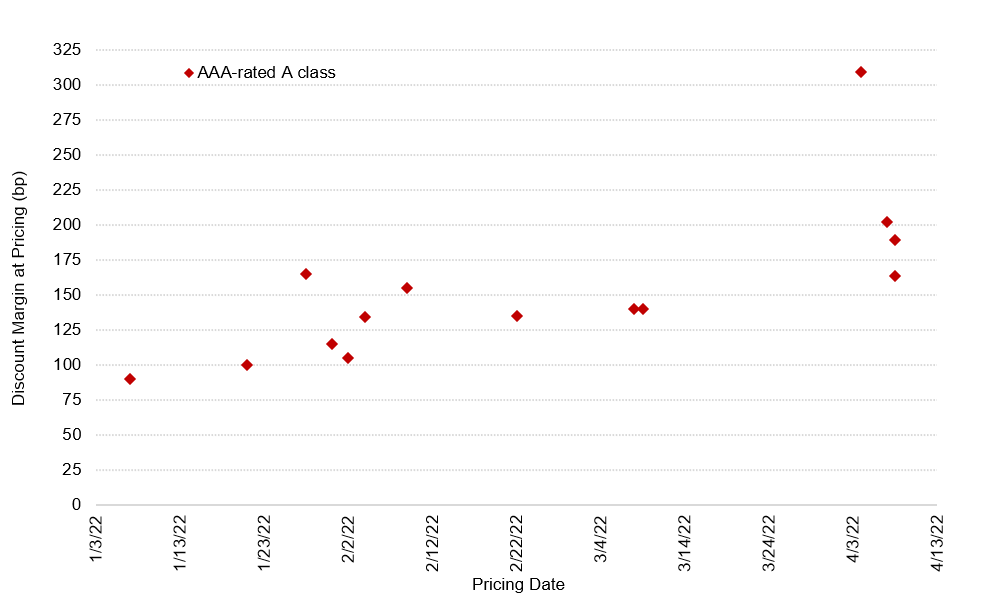
Note: Discount margins shown are to original maturity. Loans that have extension options and price away from par can have significantly different discount margins to full extension.
Source: Bloomberg, Amherst Pierpont Santander
The impact of the floating rate index
Given the rising rate environment, investors are pushing for classes indexed to forward-looking SOFR as opposed to backward-looking SOFR in part due to the substantial difference between the two. Forward-looking 1-month term SOFR is currently 74 bp compared to backward-looking 30-day compounded average SOFR which is 29 bp (Exhibit 4).
The backward-looking index will catch up to forward-looking SOFR assuming that the Fed does raise rates by the amount and on the schedule as what is currently priced in. In a declining rate environment, the reverse will also be true – forward-looking SOFR will fall ahead of backward-looking SOFR, which will reflect the rate drop steadily over time.
Exhibit 4: Forward- vs backward-looking 1-month SOFR
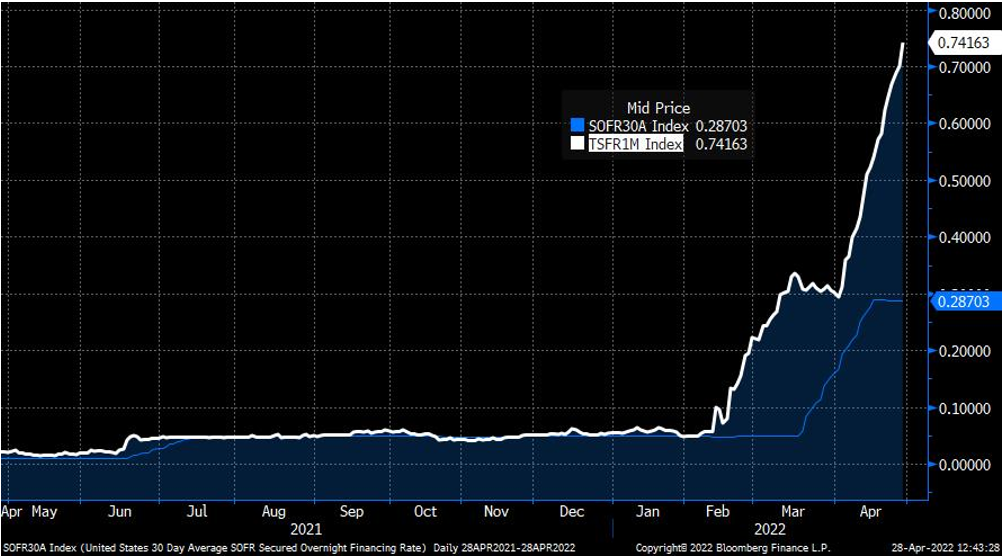
Source: Bloomberg
This material is intended only for institutional investors and does not carry all of the independence and disclosure standards of retail debt research reports. In the preparation of this material, the author may have consulted or otherwise discussed the matters referenced herein with one or more of SCM’s trading desks, any of which may have accumulated or otherwise taken a position, long or short, in any of the financial instruments discussed in or related to this material. Further, SCM may act as a market maker or principal dealer and may have proprietary interests that differ or conflict with the recipient hereof, in connection with any financial instrument discussed in or related to this material.
This message, including any attachments or links contained herein, is subject to important disclaimers, conditions, and disclosures regarding Electronic Communications, which you can find at https://portfolio-strategy.apsec.com/sancap-disclaimers-and-disclosures.
Important Disclaimers
Copyright © 2026 Santander US Capital Markets LLC and its affiliates (“SCM”). All rights reserved. SCM is a member of FINRA and SIPC. This material is intended for limited distribution to institutions only and is not publicly available. Any unauthorized use or disclosure is prohibited.
In making this material available, SCM (i) is not providing any advice to the recipient, including, without limitation, any advice as to investment, legal, accounting, tax and financial matters, (ii) is not acting as an advisor or fiduciary in respect of the recipient, (iii) is not making any predictions or projections and (iv) intends that any recipient to which SCM has provided this material is an “institutional investor” (as defined under applicable law and regulation, including FINRA Rule 4512 and that this material will not be disseminated, in whole or part, to any third party by the recipient.
The author of this material is an economist, desk strategist or trader. In the preparation of this material, the author may have consulted or otherwise discussed the matters referenced herein with one or more of SCM’s trading desks, any of which may have accumulated or otherwise taken a position, long or short, in any of the financial instruments discussed in or related to this material. Further, SCM or any of its affiliates may act as a market maker or principal dealer and may have proprietary interests that differ or conflict with the recipient hereof, in connection with any financial instrument discussed in or related to this material.
This material (i) has been prepared for information purposes only and does not constitute a solicitation or an offer to buy or sell any securities, related investments or other financial instruments, (ii) is neither research, a “research report” as commonly understood under the securities laws and regulations promulgated thereunder nor the product of a research department, (iii) or parts thereof may have been obtained from various sources, the reliability of which has not been verified and cannot be guaranteed by SCM, (iv) should not be reproduced or disclosed to any other person, without SCM’s prior consent and (v) is not intended for distribution in any jurisdiction in which its distribution would be prohibited.
In connection with this material, SCM (i) makes no representation or warranties as to the appropriateness or reliance for use in any transaction or as to the permissibility or legality of any financial instrument in any jurisdiction, (ii) believes the information in this material to be reliable, has not independently verified such information and makes no representation, express or implied, with regard to the accuracy or completeness of such information, (iii) accepts no responsibility or liability as to any reliance placed, or investment decision made, on the basis of such information by the recipient and (iv) does not undertake, and disclaims any duty to undertake, to update or to revise the information contained in this material.
Unless otherwise stated, the views, opinions, forecasts, valuations, or estimates contained in this material are those solely of the author, as of the date of publication of this material, and are subject to change without notice. The recipient of this material should make an independent evaluation of this information and make such other investigations as the recipient considers necessary (including obtaining independent financial advice), before transacting in any financial market or instrument discussed in or related to this material.
Important disclaimers for clients in the EU and UK
This publication has been prepared by Trading Desk Strategists within the Sales and Trading functions of Santander US Capital Markets LLC (“SanCap”), the US registered broker-dealer of Santander Corporate & Investment Banking. This communication is distributed in the EEA by Banco Santander S.A., a credit institution registered in Spain and authorised and regulated by the Bank of Spain and the CNMV. Any EEA recipient of this communication that would like to affect any transaction in any security or issuer discussed herein should do so with Banco Santander S.A. or any of its affiliates (together “Santander”). This communication has been distributed in the UK by Banco Santander, S.A.’s London branch, authorised by the Bank of Spain and subject to regulatory oversight on certain matters by the Financial Conduct Authority (FCA) and the Prudential Regulation Authority (PRA).
The publication is intended for exclusive use for Professional Clients and Eligible Counterparties as defined by MiFID II and is not intended for use by retail customers or for any persons or entities in any jurisdictions or country where such distribution or use would be contrary to local law or regulation.
This material is not a product of Santander´s Research Team and does not constitute independent investment research. This is a marketing communication and may contain ¨investment recommendations¨ as defined by the Market Abuse Regulation 596/2014 ("MAR"). This publication has not been prepared in accordance with legal requirements designed to promote the independence of research and is not subject to any prohibition on dealing ahead of the dissemination of investment research. The author, date and time of the production of this publication are as indicated herein.
This publication does not constitute investment advice and may not be relied upon to form an investment decision, nor should it be construed as any offer to sell or issue or invitation to purchase, acquire or subscribe for any instruments referred herein. The publication has been prepared in good faith and based on information Santander considers reliable as of the date of publication, but Santander does not guarantee or represent, express or implied, that such information is accurate or complete. All estimates, forecasts and opinions are current as at the date of this publication and are subject to change without notice. Unless otherwise indicated, Santander does not intend to update this publication. The views and commentary in this publication may not be objective or independent of the interests of the Trading and Sales functions of Santander, who may be active participants in the markets, investments or strategies referred to herein and/or may receive compensation from investment banking and non-investment banking services from entities mentioned herein. Santander may trade as principal, make a market or hold positions in instruments (or related derivatives) and/or hold financial interest in entities discussed herein. Santander may provide market commentary or trading strategies to other clients or engage in transactions which may differ from views expressed herein. Santander may have acted upon the contents of this publication prior to you having received it.
This publication is intended for the exclusive use of the recipient and must not be reproduced, redistributed or transmitted, in whole or in part, without Santander’s consent. The recipient agrees to keep confidential at all times information contained herein.


