


The Big Idea
Deglobalization and the demand for US debt
Steven Abrahams | April 29, 2022
This material is a Marketing Communication and does not constitute Independent Investment Research.
The Russia-Ukraine war has raised the real possibility that the last nearly 30 years of expanding world trade and capital flows will shift into reverse. If so, US debt markets could lose parts of an audience that now holds nearly 24% of outstanding securities. But rather than a wholesale reversal, it seems more likely that trade and capital flow will shift into blocs aligned roughly with stance on the war. In that case, there is only modest risk to the Treasury and agency MBS markets and little risk beyond.
Foreign portfolios have more than doubled their share of US debt markets in the last 30 years, rising from 10% just after the 1989 fall of the Berlin Wall to nearly 24% lately (Exhibit 1). Most of the runup came between the 1997 Asia financial crisis and the 2008 Great Financial Crisis. Foreign central banks mainly in Asia built up significant US dollar reserves through trade surplus and currency policy during that period and invested in US Treasury debt and agency MBS. Private portfolios mainly in Europe went looking for safe, floating-rate debt and invested heavily in senior classes of US structured products. Share roughly plateaued after the 2008 crisis has slipped since mid-2017 as rising tariffs around the world reduced trade and capital flows.
Exhibit 1: Globalization has more than doubled foreign investment in US debt
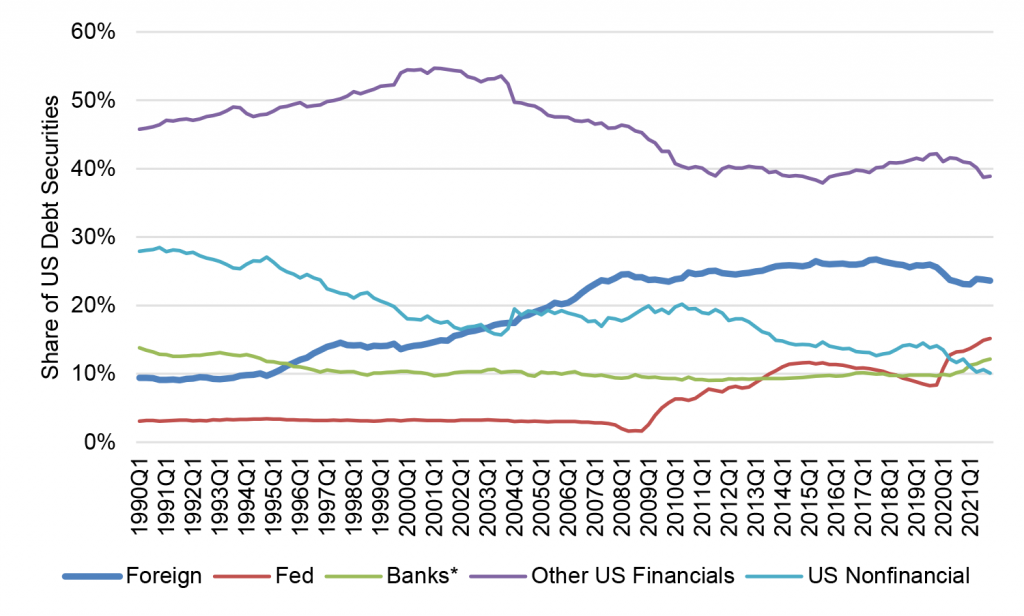
Note: Banks include commercial banks, thrifts and credit unions.
Source: Federal Reserve Z.1, Amherst Pierpont Securities
If trade and capital flows went into reverse or foreign investors simply became more wary of investing in instruments subject to asset freeze, seizure or sanctions that could block repayment, US markets would feel the effects. Foreign portfolios hold 40% of outstanding US Treasury debt, based on the Treasury International Capital System estimates as of June 30, 2020, 30% of outstanding corporate debt, including ABS and corporate bonds, and 15% of agency debt and MBS. Share of Treasury debt and agency MBS has declined since 2008 while share of corporate debt has picked up.
Full reversal of globalization seems unlikely since trade and capital flows have raised the standard of living in most countries, although clearly creating political friction in communities hurt in the process. Instead, Russia-Ukraine and the world’s response has made it more plausible that trade and capital flows would break into blocs held together by shared national interests. Trade and capital would flow relatively freely within a bloc, although probably reduced somewhat from the pace of the last 30 years by the risk the bloc one day fragments. Flows between blocs would drop off.
One possible roadmap to different trade blocs is the country-by-country vote on the March 2 UN General Assembly Resolution ES-11/1 condemning aggression against Ukraine. Five countries voted “no,” 35 countries voted “abstain” and 141 countries voted “yes.” The “no” votes included Russia, Belarus, North Korea, Syria and Eritrea. More importantly, the “abstain” votes included China and India. The ”yes” votes notably included the EU, UK, Japan, South Korea, Canada, Australia and most of the Middle East and Latin America.
The Treasury International Capital System’s estimated country-by-country holdings allows a mapping between the UN vote and holdings in US debt securities. It is clear that countries voting “yes” on the resolution hold the overwhelming majority of US debt securities (Exhibit 2). Countries voting “yes” hold 87.2% of all US debt held in foreign portfolios, although the percentage varies across products. The share held by the “yes” bloc drops to 79.6% for Treasury debt and 82% for agency MBS. It rises to 90.2% for agency debt, 98.8% for ABS and 99.5% for corporate debt.
Exhibit 2: Holdings in US debt securities by UN vote condemning Ukraine war
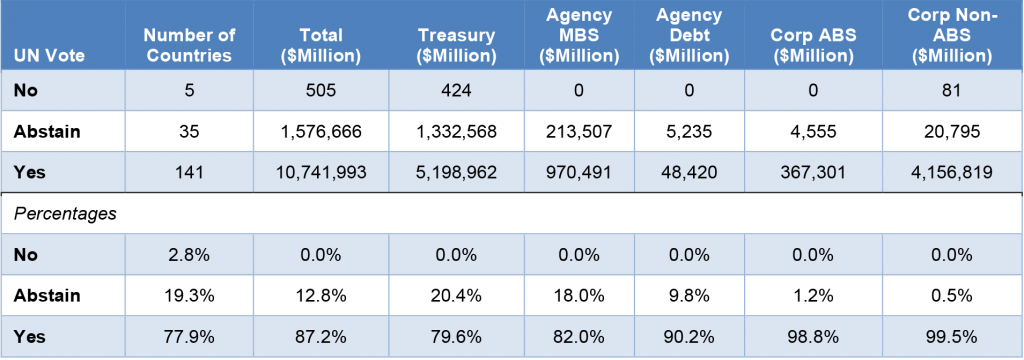
Note: Vote on UN General Assembly Resolution ES-11/1, March 2, 2022. Percentages show percent of tally from the “No,” “Abstain” and “Yes” rows immediately above.
Source: TICS, United Nations, Amherst Pierpont Securities.
The Treasury and agency MBS markets look to have the most at stake in any shifts in world trade and capital flows over coming years, although the stakes still are modest with roughly a fifth of foreign holdings in the hands of countries that that voted “no” or “abstain” on the UN resolution. The ABS and corporate debt markets have the least at stake, with almost no holdings in those hands.
A single vote on a UN resolution does not an ally make, but trade and capital after Russia-Ukraine have clearly become more important levers of national interest than ever before. Just as foreign flows into US markets shaped the level of rates, the yield curve and risk spreads over the last 30 years, flows out or realignments stand to have equally important effects.
* * *
The view in rates
The rates market continues to reprice to higher yields, but the bulk of repricing is likely over. Shorter maturities should reprice higher to reflect high terminal fed funds rates. The longer end of the curve looks wide to fair value. The curve should invert significantly over the next year with 2-year rates approaching 3.5% and 10-year rates within range of 2.5%. Persistent supply and trade frictions from Russia-Ukraine could force the Fed to go higher than currently priced and push the 2-year note well above current forward rates. Friday closing rates on 10-year and longer Treasury debt at 2.93% and higher look like the wide end of fair value—more than enough to compensate for likely 2% inflation and 0.5% in real rates.
The Fed’s RRP balances closed Friday at $1.906 trillion, up nearly $142 billion in the last week and a new record high. The RRP rate after the March 16 FOMC rose from 5 bp to 30 bp, and the race is on to see if banks raise rates to defend their deposit base or let deposits flow into money market funds and on to the RRP.
Settings on 3-month LIBOR have closed Friday at 129 bp, up 10 bp in the last week. Setting on 3-month SOFR have drifted up to 114 bp, up 16 bp in the last week. The gap between the benchmarks is narrowing.
The 10-year note has finished the most recent session at 2.93%, up 3 bp in a week. Breakeven 10-year inflation finished the week at 294 bp, down 4 bp on the week. The 10-year real rate finished the week a fraction of a basis point below zero, up 8 bp from a week ago. If 10-year real rates go positive soon, it will be the first time since early 2020. Real rates increasingly anticipate an aggressive Fed will drain the system of an overhang of cash supply.
The Treasury yield curve has finished its most recent session with 2s10s at 22 bp and 5s30s at 4 bp, both slightly steeper over the last week.
The view in spreads
Spreads still look broadly biased to widen in both MBS and credit. Nominal MBS spreads will probably have to trade wider than the average investment grade corporate issue before it becomes compelling relative value for total return investors. Of the major spread markets, corporate and structured credit is likely to outperform, as it has generally since March 2020. Corporates benefit from strong corporate fundamentals and from buyers not tied to Fed policy. The credit markets have a diversified base of buyers while the only net buyers of MBS during pandemic have been the Fed and banks.
The view in credit
Credit fundamentals look strong for now but will almost certainly soften later this year as the Fed dampens demand and growth begins to slow. Russia-Ukraine should have limited direct impact on either the US corporate or consumer balance sheet. Corporations have strong earnings, good margins, low multiples of debt to gross profits, low debt service and good liquidity. It will be important to watch inflation and see if costs begin to catch up with revenues. A higher real cost of funds would start to eat away at highly leveraged balance sheets with weak or volatile revenues. Consumer balance sheets look strong with rising income, substantial savings and big gains in real estate and investment portfolios. Homeowner equity jumped by $3.5 trillion in 2021, and mortgage delinquencies have dropped to a record low.