By the Numbers
A wide gap opens between conforming and jumbo mortgage rates
This material is a Marketing Communication and does not constitute Independent Investment Research.
The Fed’s changing appetite for agency MBS has likely helped shift the spread between conforming balance and jumbo mortgage rates. The average conforming borrower lately gets a rate 45 bp higher than the average jumbo borrower. The unusually wide spread should encourage banks to hold onto conforming loans and lower the securitization rate into agency MBS, forces that should narrow the spread eventually. It also creates prepayment differences between the sectors.
The difference between mortgage rates on conforming balance and jumbo loans has moved significantly this year. Both types of borrowers saw 30-year mortgage rates around 3.31% in early January, according to the Mortgage Bankers Association weekly survey of originators, but through April 8 the conforming average moved to 5.13% while the jumbo average moved only to 4.68% (Exhibit 1).
Exhibit 1: A wide gap between conforming balance and jumbo mortgage rates
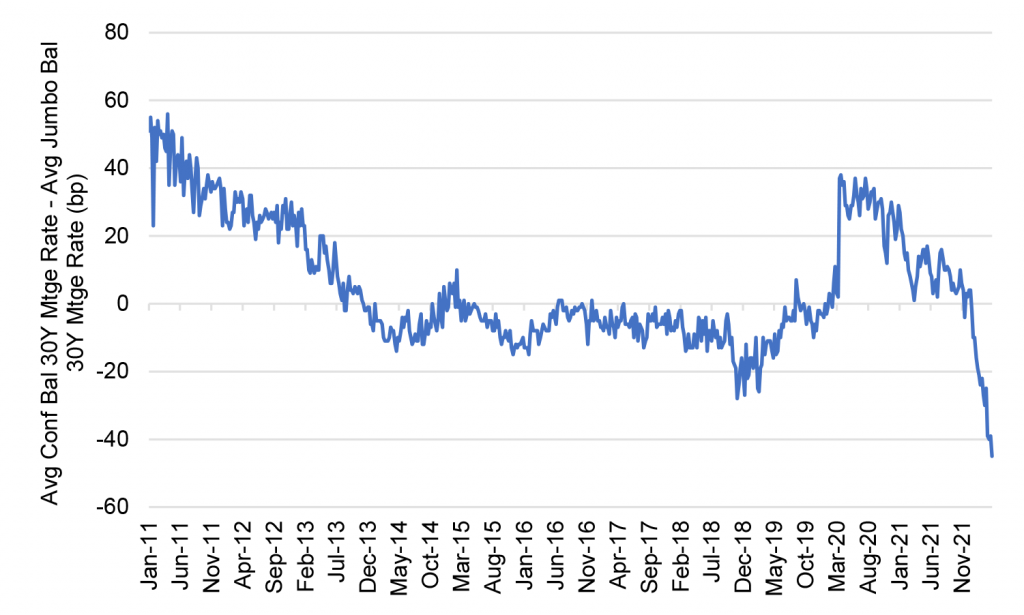
Source: Mortgage Bankers Association
The most likely explanation for the sudden shift in rates is the change in Fed plans for holding MBS. The Fed signaled last year its intention to end QE by March. But this year it appears poised to let its portfolio run off and has floated the possibility of eventually selling MBS. A study of the spread between conforming and jumbo rates done at the American Enterprise Institute found that QE after 2008 helped pull conforming rates below jumbo and continued to influence the spread as the Fed let its portfolio plateau from 2014 through 2017 and then decline into early 2020. Other factors have played a part, too, including changes in Fannie Mae and Freddie Mac guarantee fees and differences in risk attributes between conforming and jumbo borrowers. The start of QE in March 2020 again pulled conforming rates below jumbo. And the anticipation of a Fed exit lately has likely pushed conforming rates above jumbo.
With the average note rate on conforming balances higher than on jumbo—controlling, of course, for differences in LTV, credit score and other risks—banks should see the conforming balances as better value and retain the loans in portfolio. The conforming loan has less negative convexity than the jumbo loan yet carries better due to the higher note rate. Banks may also shift some marginal lending toward conforming balances and away from jumbo. That should reduce the rates of securitization into agency pools, trim pool supply and help narrow the spread between conforming and jumbo loans.
In the meantime, the significant difference between conforming and jumbo rates changes relative prepayment risk across the sectors of the market. For the same note rate, a jumbo loan lately has had an extra 45 bp of incentive to refinance, which creates more negative convexity in the jumbo market. On the other hand, lower mortgage rates make it less expensive to sell one home and buy another, which could add a boost to prepayment speeds and reduce the negative convexity of discount jumbo MBS.
This material is intended only for institutional investors and does not carry all of the independence and disclosure standards of retail debt research reports. In the preparation of this material, the author may have consulted or otherwise discussed the matters referenced herein with one or more of SCM’s trading desks, any of which may have accumulated or otherwise taken a position, long or short, in any of the financial instruments discussed in or related to this material. Further, SCM may act as a market maker or principal dealer and may have proprietary interests that differ or conflict with the recipient hereof, in connection with any financial instrument discussed in or related to this material.
This message, including any attachments or links contained herein, is subject to important disclaimers, conditions, and disclosures regarding Electronic Communications, which you can find at https://portfolio-strategy.apsec.com/sancap-disclaimers-and-disclosures.
Important Disclaimers
Copyright © 2026 Santander US Capital Markets LLC and its affiliates (“SCM”). All rights reserved. SCM is a member of FINRA and SIPC. This material is intended for limited distribution to institutions only and is not publicly available. Any unauthorized use or disclosure is prohibited.
In making this material available, SCM (i) is not providing any advice to the recipient, including, without limitation, any advice as to investment, legal, accounting, tax and financial matters, (ii) is not acting as an advisor or fiduciary in respect of the recipient, (iii) is not making any predictions or projections and (iv) intends that any recipient to which SCM has provided this material is an “institutional investor” (as defined under applicable law and regulation, including FINRA Rule 4512 and that this material will not be disseminated, in whole or part, to any third party by the recipient.
The author of this material is an economist, desk strategist or trader. In the preparation of this material, the author may have consulted or otherwise discussed the matters referenced herein with one or more of SCM’s trading desks, any of which may have accumulated or otherwise taken a position, long or short, in any of the financial instruments discussed in or related to this material. Further, SCM or any of its affiliates may act as a market maker or principal dealer and may have proprietary interests that differ or conflict with the recipient hereof, in connection with any financial instrument discussed in or related to this material.
This material (i) has been prepared for information purposes only and does not constitute a solicitation or an offer to buy or sell any securities, related investments or other financial instruments, (ii) is neither research, a “research report” as commonly understood under the securities laws and regulations promulgated thereunder nor the product of a research department, (iii) or parts thereof may have been obtained from various sources, the reliability of which has not been verified and cannot be guaranteed by SCM, (iv) should not be reproduced or disclosed to any other person, without SCM’s prior consent and (v) is not intended for distribution in any jurisdiction in which its distribution would be prohibited.
In connection with this material, SCM (i) makes no representation or warranties as to the appropriateness or reliance for use in any transaction or as to the permissibility or legality of any financial instrument in any jurisdiction, (ii) believes the information in this material to be reliable, has not independently verified such information and makes no representation, express or implied, with regard to the accuracy or completeness of such information, (iii) accepts no responsibility or liability as to any reliance placed, or investment decision made, on the basis of such information by the recipient and (iv) does not undertake, and disclaims any duty to undertake, to update or to revise the information contained in this material.
Unless otherwise stated, the views, opinions, forecasts, valuations, or estimates contained in this material are those solely of the author, as of the date of publication of this material, and are subject to change without notice. The recipient of this material should make an independent evaluation of this information and make such other investigations as the recipient considers necessary (including obtaining independent financial advice), before transacting in any financial market or instrument discussed in or related to this material.
Important disclaimers for clients in the EU and UK
This publication has been prepared by Trading Desk Strategists within the Sales and Trading functions of Santander US Capital Markets LLC (“SanCap”), the US registered broker-dealer of Santander Corporate & Investment Banking. This communication is distributed in the EEA by Banco Santander S.A., a credit institution registered in Spain and authorised and regulated by the Bank of Spain and the CNMV. Any EEA recipient of this communication that would like to affect any transaction in any security or issuer discussed herein should do so with Banco Santander S.A. or any of its affiliates (together “Santander”). This communication has been distributed in the UK by Banco Santander, S.A.’s London branch, authorised by the Bank of Spain and subject to regulatory oversight on certain matters by the Financial Conduct Authority (FCA) and the Prudential Regulation Authority (PRA).
The publication is intended for exclusive use for Professional Clients and Eligible Counterparties as defined by MiFID II and is not intended for use by retail customers or for any persons or entities in any jurisdictions or country where such distribution or use would be contrary to local law or regulation.
This material is not a product of Santander´s Research Team and does not constitute independent investment research. This is a marketing communication and may contain ¨investment recommendations¨ as defined by the Market Abuse Regulation 596/2014 ("MAR"). This publication has not been prepared in accordance with legal requirements designed to promote the independence of research and is not subject to any prohibition on dealing ahead of the dissemination of investment research. The author, date and time of the production of this publication are as indicated herein.
This publication does not constitute investment advice and may not be relied upon to form an investment decision, nor should it be construed as any offer to sell or issue or invitation to purchase, acquire or subscribe for any instruments referred herein. The publication has been prepared in good faith and based on information Santander considers reliable as of the date of publication, but Santander does not guarantee or represent, express or implied, that such information is accurate or complete. All estimates, forecasts and opinions are current as at the date of this publication and are subject to change without notice. Unless otherwise indicated, Santander does not intend to update this publication. The views and commentary in this publication may not be objective or independent of the interests of the Trading and Sales functions of Santander, who may be active participants in the markets, investments or strategies referred to herein and/or may receive compensation from investment banking and non-investment banking services from entities mentioned herein. Santander may trade as principal, make a market or hold positions in instruments (or related derivatives) and/or hold financial interest in entities discussed herein. Santander may provide market commentary or trading strategies to other clients or engage in transactions which may differ from views expressed herein. Santander may have acted upon the contents of this publication prior to you having received it.
This publication is intended for the exclusive use of the recipient and must not be reproduced, redistributed or transmitted, in whole or in part, without Santander’s consent. The recipient agrees to keep confidential at all times information contained herein.


