The Big Idea
A brief history of Fed policy expectations
This material is a Marketing Communication and does not constitute Independent Investment Research.
The past few months have seen one of the largest and most abrupt revisions of market expectations for the Fed in decades. The past 20 years have seen the Fed keep policy rates relatively low and make only gradual and well-telegraphed changes. With inflation exploding higher as the economy recovers from pandemic, the Fed will not have the luxury of being “measured” or “patient.” Rather, the Fed is scrambling to catch inflation. One good bit of news is that the drastic shift in policy expectations has not created undesirable financial instability or a sharp markdown in economic prospects.
Comparing today to 2004-2006 and 2015-2018
The early stages of the current rate hike cycle are shaping up to be quite different from the last two cycles. There is clearly no comparison to the muted 2015-2018 rate hikes. Meanwhile, in the 2004-2006 period, the FOMC raised the funds rate target by 425 bp over two years, but the moves were made in steady 25 bp increments at 17 consecutive FOMC meetings and there was little uncertainty about the magnitude and timing of the Fed’s next move once the cycle got started.
In the run-up to the first rate hike in June 2004, there was an intense debate in the financial markets over whether the initial tightening would be 25 bp or 50 bp. Once the Fed started with 25 bp and included forward guidance in the FOMC statement that described the Fed’s approach as removing accommodation at a “measured pace,” fed funds futures never priced in more than 100 bp of tightening over the next six months, as quantified by the gap between the rolling 6-month-ahead fed funds futures contract and the actual funds rate target ( Exhibit 1).
Exhibit 1: 6-month-ahead fed funds futures tightening expectations: 2004
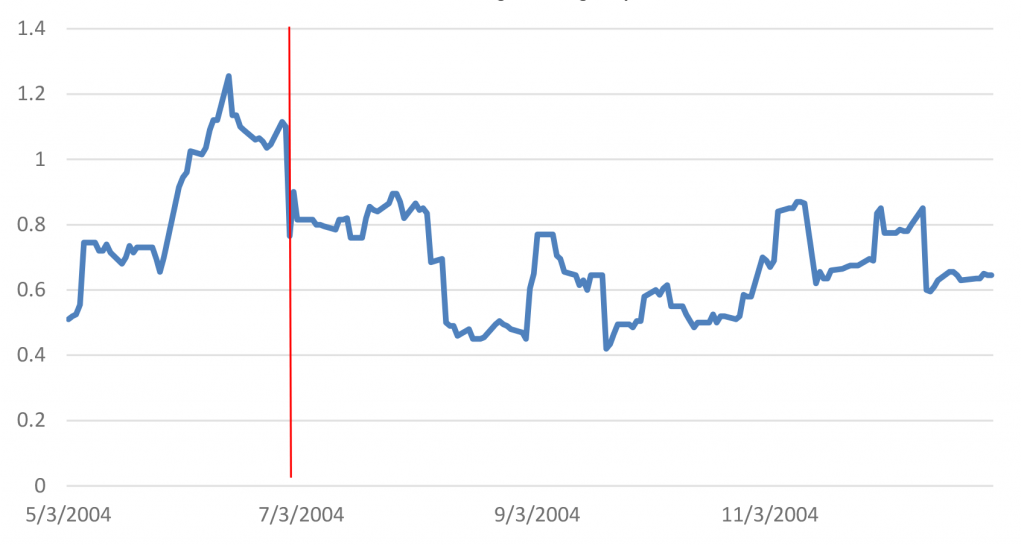
Source: Bloomberg, Federal Reserve.
Comparing today to 1994-1995
The closest analog to the current rate hike cycle in terms of pace and magnitude in recent history might be the 1994-1995 episode, when the Federal Reserve raised rates by 300 bp in a year, taking the funds rate from 3% to 6%. However, one key difference between 1994 and the current cycle is that expectations were muted to start and only ramped up later. The day before the first rate hike in 1994, which occurred February 4, the 6-month ahead fed funds futures contract indicated that investors were pricing in a modest 59 bp of rate hikes over the next six months (Exhibit 2). That expectation remained in a range between 50 bp and 100 bp until May, when the Fed raised rates by 50 bp for the first time in the cycle. In fact, it was not until the late stages of the cycle, in the fourth quarter of 1994, before 6-month expectations peaked in the neighborhood of 160 bp to 180 bp.
Exhibit 2: 6-Month-ahead fed funds futures tightening expectations: 1994
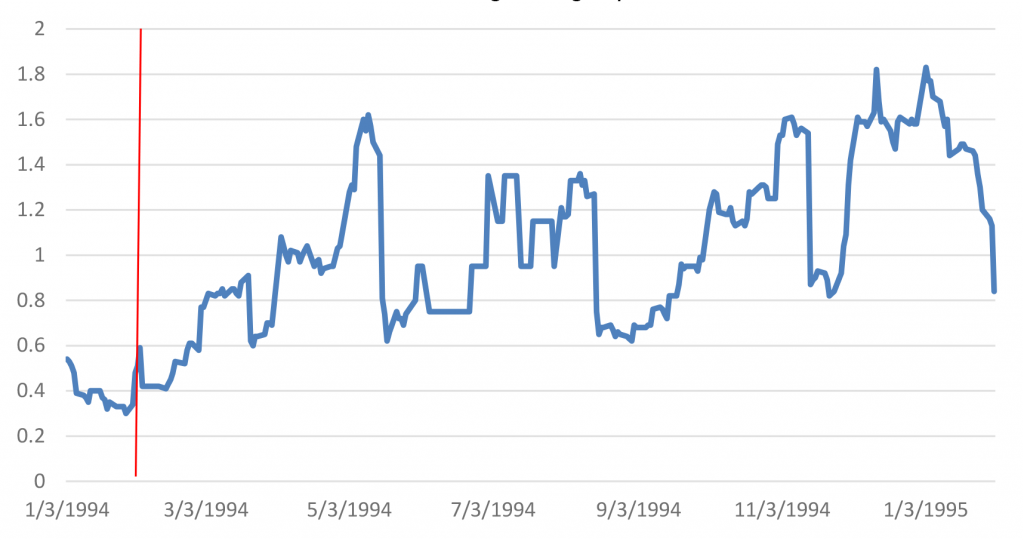
Source: Bloomberg, Federal Reserve.
Indeed, as it turned out, market expectations for Fed tightening in late 1994 well overshot what actually happened. The 6-month-ahead fed funds futures contract surged above 7% in December 1994, when the actual funds rate was 5.50%, but the Fed ended up stopping at 6%.
The current cycle
Compared to these two earlier cycles, the beginning of the current rate hike campaign has been far more tumultuous. While expectations six months ahead were quite restrained through late January, the implied amount of rate hikes priced in for the next six months has steadily ratcheted higher since then. It hit 100 bp in February, dipped briefly at the onset of the Russian invasion of Ukraine, and then resumed a rapid uptrend, reaching 160 bp this week, a level rarely reached in 1994 and mainly near the end of the cycle (Exhibit 3).
Exhibit 3: 6-Month-ahead fed funds futures tightening expectations: 2022
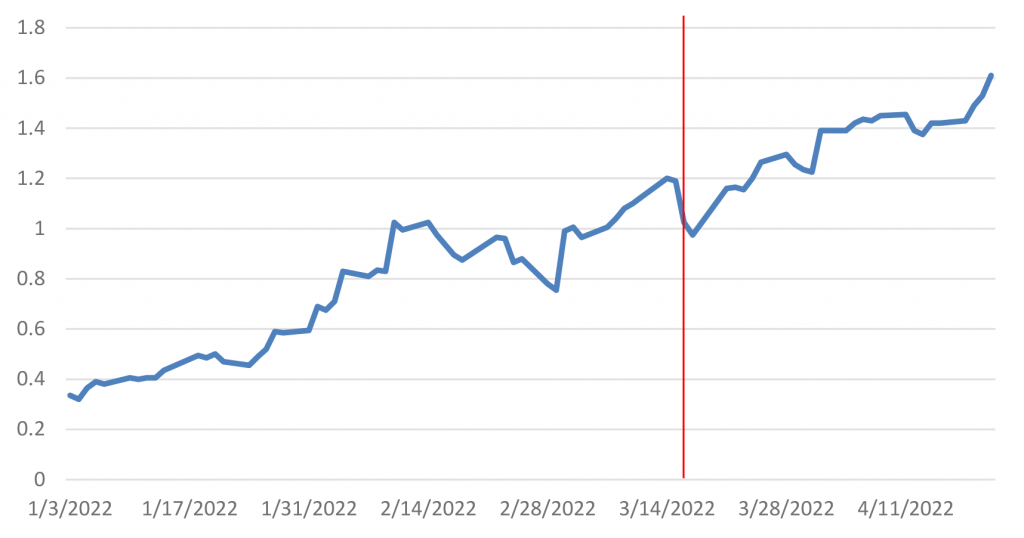
Source: Bloomberg, Federal Reserve.
The ascent of expectations for tightening within a 6-month window since the beginning of the year has actually been similar in magnitude to the experience of 1994. Over the three months from mid-February (just after liftoff) to mid-May in 1994, financial markets went from pricing in 40 bp of rate hikes to 160 bp, though, to be fair, that peak was fleeting and expectations for further tightening receded substantially after the FOMC’s 50 bp rate hike in May. This year, from late-January to April 21, also a 3-month stretch, rate hike expectations surged from less than 50 bp to more than 160 bp.
The main difference from 1994 to today is that financial markets saw the rate hikes coming earlier and began pricing them in before the fact. This reflects the main substantive difference between 1994 and this year, which bears importantly on the Fed’s prospects for success. In 1994, Chairman Greenspan and company raised rates pre-emptively and were able to fend off a sharp increase in inflation. In contrast, Chair Powell’s Fed explicitly ruled out pre-emptive moves with its change in framework implemented in 2020 and then waited until well after inflation had accelerated to begin to unwind their extraordinarily stimulative stance.
Peak of the cycle
There has also been a rapid evolution in the expected peak fed funds rate for the upcoming cycle so far this year. The September 2023 3-month SOFR futures contract has provided a decent proxy for where investors expect the rate hike cycle to top out. Six weeks ago, on March 7, the contract yielded 1.89%. It has soared by over 140 bp since then and was trading on April 21 at just over 3.30%.
While the eventual peak of the cycle may well exceed that level, the bulk of the adjustment that was needed in the level of expected policy and thus in the level of various interest rates has occurred. Unlike in 1994, when that adjustment took place over an extended period, at least six months, today’s more forward-looking markets have accelerated the process, pricing in the bulk of the adjustment in a short period, just a couple of months.
Weathering the storm
One might imagine that such a massive shift in policy expectations could create significant economic ripple effects. It was not so long ago that many economists and market players were arguing that the economy would not be able to handle policy rates anywhere above 2% without dire market and economic consequences. As inflation has accelerated further in early 2022, those concerns have mostly receded. Indeed, over the past three months, stock prices have swung up and down but have been on balance roughly flat, absorbing both a drastic shift in Fed expectations and the implications of the Russian invasion of Ukraine with impressive composure.
Fed officials have expressed cautious optimism that they will be able to engineer a soft landing, avoiding a recession even as policy will likely move rapidly from exceedingly easy to restrictive. The economy retains tremendous momentum for now, so the Fed’s task of reining in inflation is likely to be challenging, perhaps much tougher than policymakers hope. Given the late start that the FOMC has gotten in fighting inflation, while I am also hopeful, I am concerned that policy may need to remain restrictive for an extended period of time to quench price pressures. Such a policy stance runs the risk of delivering a stretch of sub-par economic growth or possibly even a recession, but probably not until 2024 or 2025.
This material is intended only for institutional investors and does not carry all of the independence and disclosure standards of retail debt research reports. In the preparation of this material, the author may have consulted or otherwise discussed the matters referenced herein with one or more of SCM’s trading desks, any of which may have accumulated or otherwise taken a position, long or short, in any of the financial instruments discussed in or related to this material. Further, SCM may act as a market maker or principal dealer and may have proprietary interests that differ or conflict with the recipient hereof, in connection with any financial instrument discussed in or related to this material.
This message, including any attachments or links contained herein, is subject to important disclaimers, conditions, and disclosures regarding Electronic Communications, which you can find at https://portfolio-strategy.apsec.com/sancap-disclaimers-and-disclosures.
Important Disclaimers
Copyright © 2026 Santander US Capital Markets LLC and its affiliates (“SCM”). All rights reserved. SCM is a member of FINRA and SIPC. This material is intended for limited distribution to institutions only and is not publicly available. Any unauthorized use or disclosure is prohibited.
In making this material available, SCM (i) is not providing any advice to the recipient, including, without limitation, any advice as to investment, legal, accounting, tax and financial matters, (ii) is not acting as an advisor or fiduciary in respect of the recipient, (iii) is not making any predictions or projections and (iv) intends that any recipient to which SCM has provided this material is an “institutional investor” (as defined under applicable law and regulation, including FINRA Rule 4512 and that this material will not be disseminated, in whole or part, to any third party by the recipient.
The author of this material is an economist, desk strategist or trader. In the preparation of this material, the author may have consulted or otherwise discussed the matters referenced herein with one or more of SCM’s trading desks, any of which may have accumulated or otherwise taken a position, long or short, in any of the financial instruments discussed in or related to this material. Further, SCM or any of its affiliates may act as a market maker or principal dealer and may have proprietary interests that differ or conflict with the recipient hereof, in connection with any financial instrument discussed in or related to this material.
This material (i) has been prepared for information purposes only and does not constitute a solicitation or an offer to buy or sell any securities, related investments or other financial instruments, (ii) is neither research, a “research report” as commonly understood under the securities laws and regulations promulgated thereunder nor the product of a research department, (iii) or parts thereof may have been obtained from various sources, the reliability of which has not been verified and cannot be guaranteed by SCM, (iv) should not be reproduced or disclosed to any other person, without SCM’s prior consent and (v) is not intended for distribution in any jurisdiction in which its distribution would be prohibited.
In connection with this material, SCM (i) makes no representation or warranties as to the appropriateness or reliance for use in any transaction or as to the permissibility or legality of any financial instrument in any jurisdiction, (ii) believes the information in this material to be reliable, has not independently verified such information and makes no representation, express or implied, with regard to the accuracy or completeness of such information, (iii) accepts no responsibility or liability as to any reliance placed, or investment decision made, on the basis of such information by the recipient and (iv) does not undertake, and disclaims any duty to undertake, to update or to revise the information contained in this material.
Unless otherwise stated, the views, opinions, forecasts, valuations, or estimates contained in this material are those solely of the author, as of the date of publication of this material, and are subject to change without notice. The recipient of this material should make an independent evaluation of this information and make such other investigations as the recipient considers necessary (including obtaining independent financial advice), before transacting in any financial market or instrument discussed in or related to this material.
Important disclaimers for clients in the EU and UK
This publication has been prepared by Trading Desk Strategists within the Sales and Trading functions of Santander US Capital Markets LLC (“SanCap”), the US registered broker-dealer of Santander Corporate & Investment Banking. This communication is distributed in the EEA by Banco Santander S.A., a credit institution registered in Spain and authorised and regulated by the Bank of Spain and the CNMV. Any EEA recipient of this communication that would like to affect any transaction in any security or issuer discussed herein should do so with Banco Santander S.A. or any of its affiliates (together “Santander”). This communication has been distributed in the UK by Banco Santander, S.A.’s London branch, authorised by the Bank of Spain and subject to regulatory oversight on certain matters by the Financial Conduct Authority (FCA) and the Prudential Regulation Authority (PRA).
The publication is intended for exclusive use for Professional Clients and Eligible Counterparties as defined by MiFID II and is not intended for use by retail customers or for any persons or entities in any jurisdictions or country where such distribution or use would be contrary to local law or regulation.
This material is not a product of Santander´s Research Team and does not constitute independent investment research. This is a marketing communication and may contain ¨investment recommendations¨ as defined by the Market Abuse Regulation 596/2014 ("MAR"). This publication has not been prepared in accordance with legal requirements designed to promote the independence of research and is not subject to any prohibition on dealing ahead of the dissemination of investment research. The author, date and time of the production of this publication are as indicated herein.
This publication does not constitute investment advice and may not be relied upon to form an investment decision, nor should it be construed as any offer to sell or issue or invitation to purchase, acquire or subscribe for any instruments referred herein. The publication has been prepared in good faith and based on information Santander considers reliable as of the date of publication, but Santander does not guarantee or represent, express or implied, that such information is accurate or complete. All estimates, forecasts and opinions are current as at the date of this publication and are subject to change without notice. Unless otherwise indicated, Santander does not intend to update this publication. The views and commentary in this publication may not be objective or independent of the interests of the Trading and Sales functions of Santander, who may be active participants in the markets, investments or strategies referred to herein and/or may receive compensation from investment banking and non-investment banking services from entities mentioned herein. Santander may trade as principal, make a market or hold positions in instruments (or related derivatives) and/or hold financial interest in entities discussed herein. Santander may provide market commentary or trading strategies to other clients or engage in transactions which may differ from views expressed herein. Santander may have acted upon the contents of this publication prior to you having received it.
This publication is intended for the exclusive use of the recipient and must not be reproduced, redistributed or transmitted, in whole or in part, without Santander’s consent. The recipient agrees to keep confidential at all times information contained herein.


