By the Numbers
The rise of technology raises CLO risk and reward
This material is a Marketing Communication and does not constitute Independent Investment Research.
CLO exposure to technology companies has drifted higher for nearly a decade, but that has accelerated recently. Technology issuers this year make up 25% of new loans. But technology loans tend to carry lower ratings and trade with more volatility than other sectors. As the Fed begins to cool the economy, technology could carry more risk than reward. And so could CLO managers that seem to be persistently overweight.
Issuance of leveraged loans tied to buyouts in technology has boomed recently, driven by record volume of M&A. The share of new-issue loans to software and data companies reached 25% of the institutional loan market this year, according to LCD, well above the historical 10% to 20% range (Exhibit 1). Remote working trends, online business service needs, infrastructure, and business intelligence investment may be contributing to the growth.
Exhibit 1: Tech leveraged loan share soars in 2022
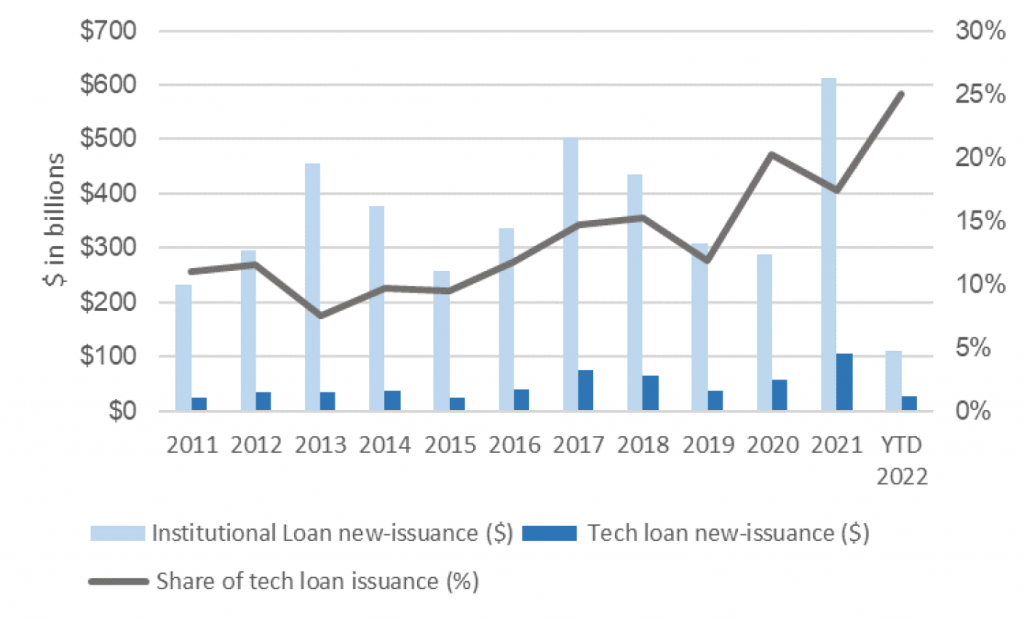
Data source: LCD
Corresponding to the tech issuance boom in the loan market, the tech share of loans in outstanding CLOs has also been trending up since 2018 (Exhibit 2). From pre-pandemic levels around 10%, it has increased to 11.5%, a shallower ramp than the loan market overall.
Exhibit 2: Average tech loan share in outstanding CLO deals by issuance year
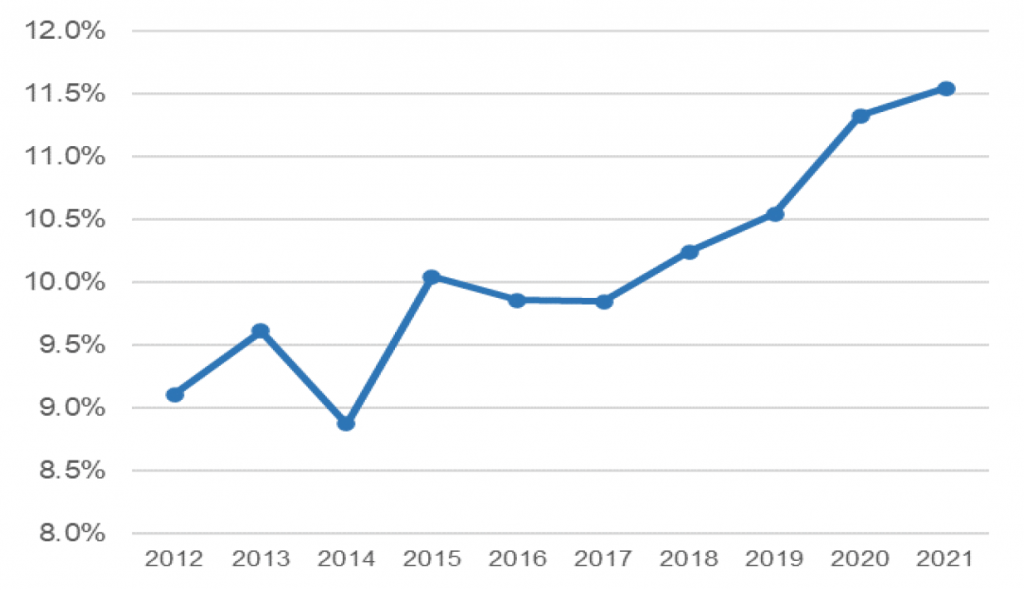
Note: Data show Moody’s industry code = high tech. Data only include outstanding CLO deals with Intex performance updates as of January or February 2022. Data shows tech share for remaining outstanding deals in each vintage.
Source: Intex, Amherst Pierpont Securities.
Not all managers have the same tech exposure. Across CLO deals issued from 2018 to 2021, the average deal tech exposure peaked in 2021 at 11.5% but with wide dispersion. A handful of CLO managers have consistently overweighted the sector in the past four years. For example, Eaton Vance, Blackrock and Neuberger Berman were on the Top 10 managers in tech exposure four years in a row (Exhibit 3).
Exhibit 3. Top U.S. CLO managers by tech exposure
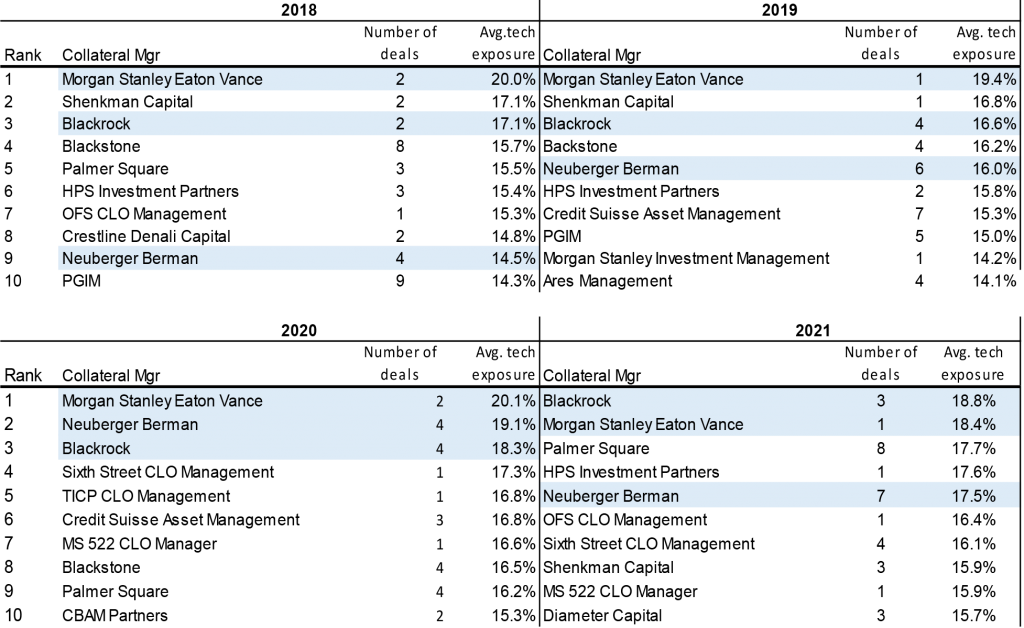
Data source: INTEX, Moody’s industry code = high tech
Despite the tech sell-off in the equity market, the credit risk of the sector has been relatively stable. In February, S&P released its latest forecast on US speculative-grade corporate defaults and doubled its baseline forecast from 1.5% in December 2021 to 3% by end of 2022. Tech companies represent 9.3% of the total speculative-grade population S&P studied, and the agency has painted an overall less gloomy picture for the sector. Specifically, the rating upgrades in the tech sector exceeded rating downgrades by 11.3%, measured by issuer on a 12-month trailing basis (net rating actions). Looking forward, S&P’s positive rating outlook in the tech sector outpaces credit watch by 5.2% (net rating bias). In contrast, the agency expects the credit watch in all speculative-grade sectors to exceed rating positive outlook by 2.2% (Exhibit 4).
Exhibit 4. S&P rating actions and outlook for speculative-grade companies by industries
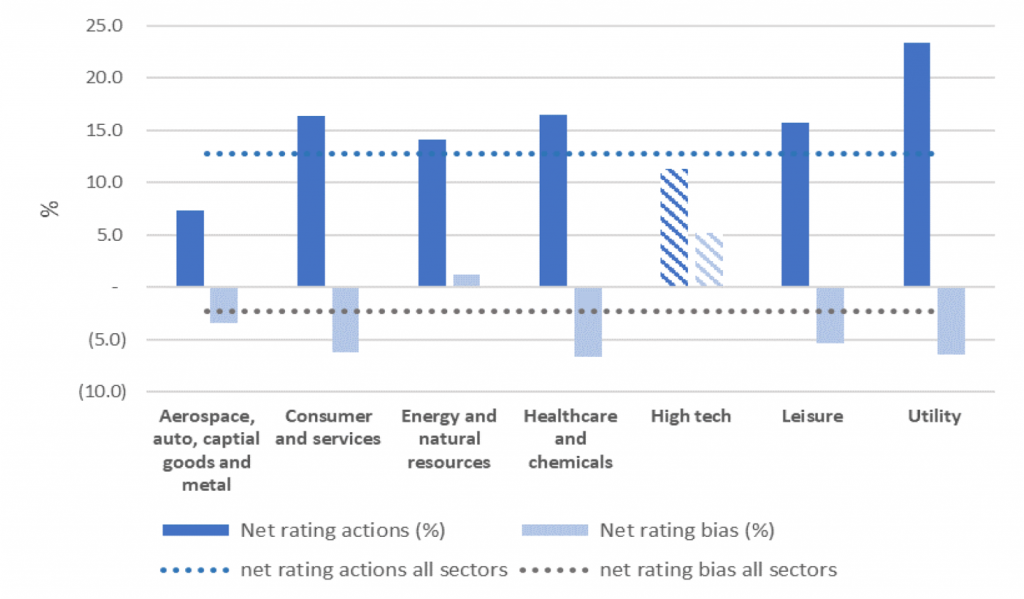
Source: S&P
It is worth noting that tech is among the most leveraged sectors in the loan market and trades with relatively high volatility compared to the overall index. Tech, health care and business equipment and services are the top three industry sectors in the leveraged loan index, representing 35% of index current market value. Forty-five percent of leveraged loans in the tech sector are ‘B-‘, much higher than the 26% in healthcare and 16% in retailers. It is also 24% higher than the leveraged loan index (Exhibit 5). In the past years, benign credit risk coupled with low interest rates has rewarded investors who assumed risk. Both ‘B’ and ‘CCC’ loans in the index have outperformed ‘BB’ rated loans in recent years, a possible explanation for some CLO managers’ favorable tech allocations.
Exhibit 5: Rating distribution of selective industries in S&P LSTA leveraged loan index.
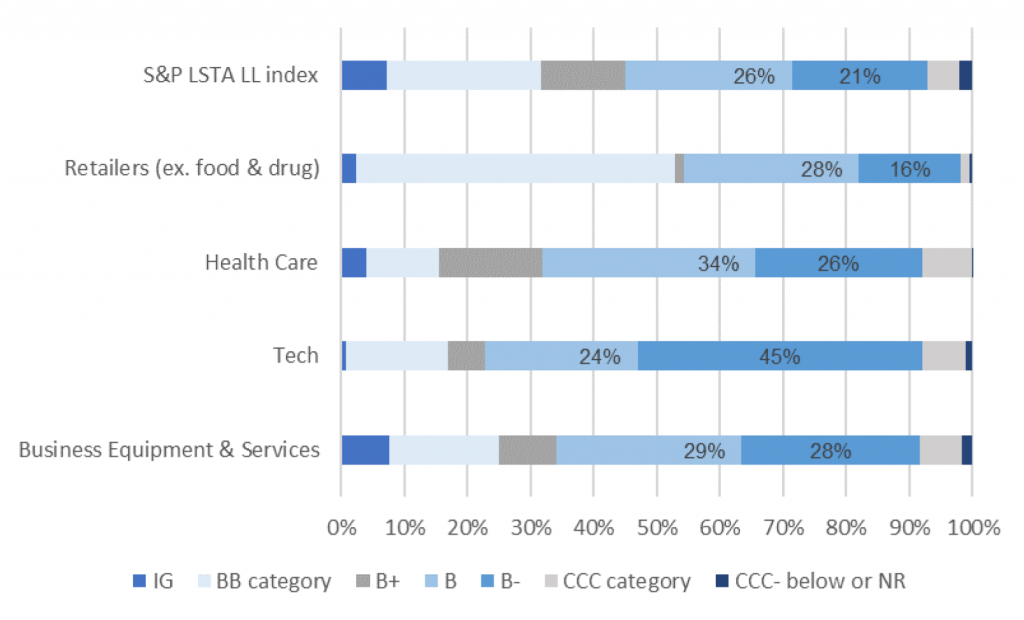
Data source: S&P LCD, rating distribution data as of March 2022.
Investors entered 2022 with a persistent inflation and heightened geopolitical risk, a very different macro-economic picture from past years. Tech loans will remain a large sector in CLOs given the issuance boom in leveraged loan space, but it is less certain whether the lower-rated, risky assets will outperform their counterparts the next time.
This material is intended only for institutional investors and does not carry all of the independence and disclosure standards of retail debt research reports. In the preparation of this material, the author may have consulted or otherwise discussed the matters referenced herein with one or more of SCM’s trading desks, any of which may have accumulated or otherwise taken a position, long or short, in any of the financial instruments discussed in or related to this material. Further, SCM may act as a market maker or principal dealer and may have proprietary interests that differ or conflict with the recipient hereof, in connection with any financial instrument discussed in or related to this material.
This message, including any attachments or links contained herein, is subject to important disclaimers, conditions, and disclosures regarding Electronic Communications, which you can find at https://portfolio-strategy.apsec.com/sancap-disclaimers-and-disclosures.
Important Disclaimers
Copyright © 2026 Santander US Capital Markets LLC and its affiliates (“SCM”). All rights reserved. SCM is a member of FINRA and SIPC. This material is intended for limited distribution to institutions only and is not publicly available. Any unauthorized use or disclosure is prohibited.
In making this material available, SCM (i) is not providing any advice to the recipient, including, without limitation, any advice as to investment, legal, accounting, tax and financial matters, (ii) is not acting as an advisor or fiduciary in respect of the recipient, (iii) is not making any predictions or projections and (iv) intends that any recipient to which SCM has provided this material is an “institutional investor” (as defined under applicable law and regulation, including FINRA Rule 4512 and that this material will not be disseminated, in whole or part, to any third party by the recipient.
The author of this material is an economist, desk strategist or trader. In the preparation of this material, the author may have consulted or otherwise discussed the matters referenced herein with one or more of SCM’s trading desks, any of which may have accumulated or otherwise taken a position, long or short, in any of the financial instruments discussed in or related to this material. Further, SCM or any of its affiliates may act as a market maker or principal dealer and may have proprietary interests that differ or conflict with the recipient hereof, in connection with any financial instrument discussed in or related to this material.
This material (i) has been prepared for information purposes only and does not constitute a solicitation or an offer to buy or sell any securities, related investments or other financial instruments, (ii) is neither research, a “research report” as commonly understood under the securities laws and regulations promulgated thereunder nor the product of a research department, (iii) or parts thereof may have been obtained from various sources, the reliability of which has not been verified and cannot be guaranteed by SCM, (iv) should not be reproduced or disclosed to any other person, without SCM’s prior consent and (v) is not intended for distribution in any jurisdiction in which its distribution would be prohibited.
In connection with this material, SCM (i) makes no representation or warranties as to the appropriateness or reliance for use in any transaction or as to the permissibility or legality of any financial instrument in any jurisdiction, (ii) believes the information in this material to be reliable, has not independently verified such information and makes no representation, express or implied, with regard to the accuracy or completeness of such information, (iii) accepts no responsibility or liability as to any reliance placed, or investment decision made, on the basis of such information by the recipient and (iv) does not undertake, and disclaims any duty to undertake, to update or to revise the information contained in this material.
Unless otherwise stated, the views, opinions, forecasts, valuations, or estimates contained in this material are those solely of the author, as of the date of publication of this material, and are subject to change without notice. The recipient of this material should make an independent evaluation of this information and make such other investigations as the recipient considers necessary (including obtaining independent financial advice), before transacting in any financial market or instrument discussed in or related to this material.
Important disclaimers for clients in the EU and UK
This publication has been prepared by Trading Desk Strategists within the Sales and Trading functions of Santander US Capital Markets LLC (“SanCap”), the US registered broker-dealer of Santander Corporate & Investment Banking. This communication is distributed in the EEA by Banco Santander S.A., a credit institution registered in Spain and authorised and regulated by the Bank of Spain and the CNMV. Any EEA recipient of this communication that would like to affect any transaction in any security or issuer discussed herein should do so with Banco Santander S.A. or any of its affiliates (together “Santander”). This communication has been distributed in the UK by Banco Santander, S.A.’s London branch, authorised by the Bank of Spain and subject to regulatory oversight on certain matters by the Financial Conduct Authority (FCA) and the Prudential Regulation Authority (PRA).
The publication is intended for exclusive use for Professional Clients and Eligible Counterparties as defined by MiFID II and is not intended for use by retail customers or for any persons or entities in any jurisdictions or country where such distribution or use would be contrary to local law or regulation.
This material is not a product of Santander´s Research Team and does not constitute independent investment research. This is a marketing communication and may contain ¨investment recommendations¨ as defined by the Market Abuse Regulation 596/2014 ("MAR"). This publication has not been prepared in accordance with legal requirements designed to promote the independence of research and is not subject to any prohibition on dealing ahead of the dissemination of investment research. The author, date and time of the production of this publication are as indicated herein.
This publication does not constitute investment advice and may not be relied upon to form an investment decision, nor should it be construed as any offer to sell or issue or invitation to purchase, acquire or subscribe for any instruments referred herein. The publication has been prepared in good faith and based on information Santander considers reliable as of the date of publication, but Santander does not guarantee or represent, express or implied, that such information is accurate or complete. All estimates, forecasts and opinions are current as at the date of this publication and are subject to change without notice. Unless otherwise indicated, Santander does not intend to update this publication. The views and commentary in this publication may not be objective or independent of the interests of the Trading and Sales functions of Santander, who may be active participants in the markets, investments or strategies referred to herein and/or may receive compensation from investment banking and non-investment banking services from entities mentioned herein. Santander may trade as principal, make a market or hold positions in instruments (or related derivatives) and/or hold financial interest in entities discussed herein. Santander may provide market commentary or trading strategies to other clients or engage in transactions which may differ from views expressed herein. Santander may have acted upon the contents of this publication prior to you having received it.
This publication is intended for the exclusive use of the recipient and must not be reproduced, redistributed or transmitted, in whole or in part, without Santander’s consent. The recipient agrees to keep confidential at all times information contained herein.


