By the Numbers
TBA, dollar roll volumes return to pre-pandemic marks
This material is a Marketing Communication and does not constitute Independent Investment Research.
MBS trading volume has fallen below the average level from 2019, a consequence of slowing refinance activity and lower MBS purchases by the Fed. And volume could fall further as it starts to reflect the full increase in mortgage rates. But strong home sales should keep net MBS supply high and offset some of the drop. Dollar roll activity also could receive a boost when the Fed begins to shrink its MBS portfolio.
TBA trading has fallen below the 2019 average
TBA trading volume has fallen since early 2021, a steady decline disrupted only by a small jump in activity in the fall. Refinance activity slowed over the course of the year as originators were left with a smaller group of borrowers able and willing to refinance. Mortgage originators routinely hedge originations with TBA contracts and roll those contracts to manage pipeline interest rate risk, so heavy origination can contribute to increased TBA and roll trading. Gross and net issuance reached record highs for Fannie Mae and Freddie Mac in 2021. Gross issuance should fall sharply in 2022 as refinancing volume vanishes. But a strong housing market should keep net supply robust.
Exhibit 1. TBA trading volume is slightly below 2019 levels
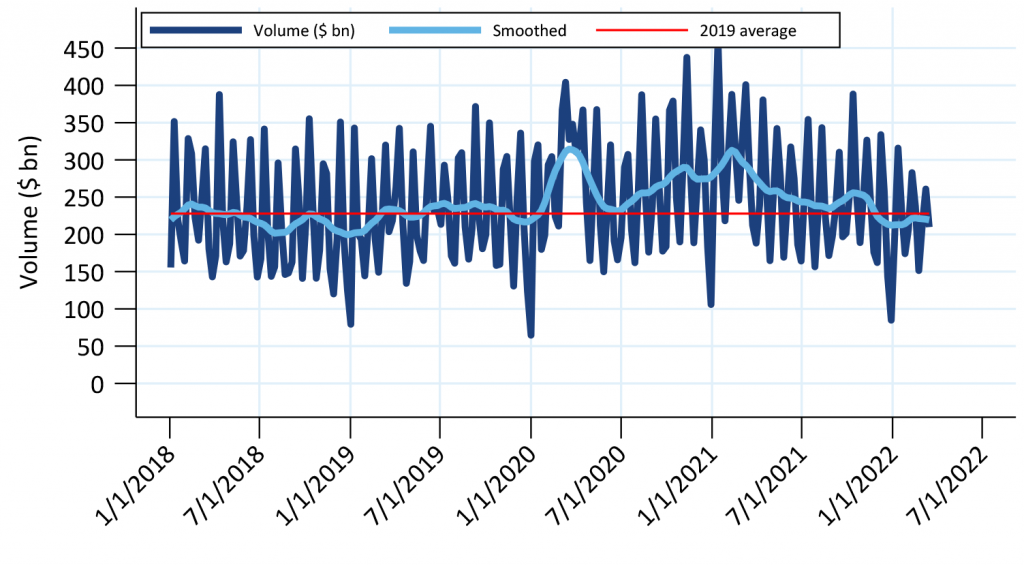
The dark blue line is weekly trading volume, the light blue is fit using LOESS to smooth seasonal variation.
Source: Federal Reserve, Amherst Pierpont Securities
The Fed’s MBS purchasing activity for most of 2021 followed a steady pace of adding $40 billion a month, so it is unlikely that contributed to falling volumes throughout the year. However, the Fed started to reduce net buying late in the year and ended net buying in March. This probably contributed to the drop in volume at the end of the year, along with a typical seasonal slowdown. The smoothed line does make it appear that volume picked up slightly over the last two months but most likely reflects the bounce back from the seasonal low at the end of each year.
Dollar roll usage has also returned to pre-pandemic levels
Dollar roll usage has also returned to 2019 levels, although that happened earlier in 2021 than it did for TBA trading. Rolls were special throughout much of the pandemic, which has typically been true when the Fed has been a heavy buyer of MBS. Many money managers and other investors chose to roll TBA instead of investing in specified pools to take advantage of the special carry. Roll specialness has generally weakened this year, although the shift to higher interest rates has caused rolls in 3.5%s and higher to spike. Market activity tracked the production coupon higher, but origination volume has not yet caught up with the move.
Exhibit 2. Dollar roll trading volume is also close to 2019 levels
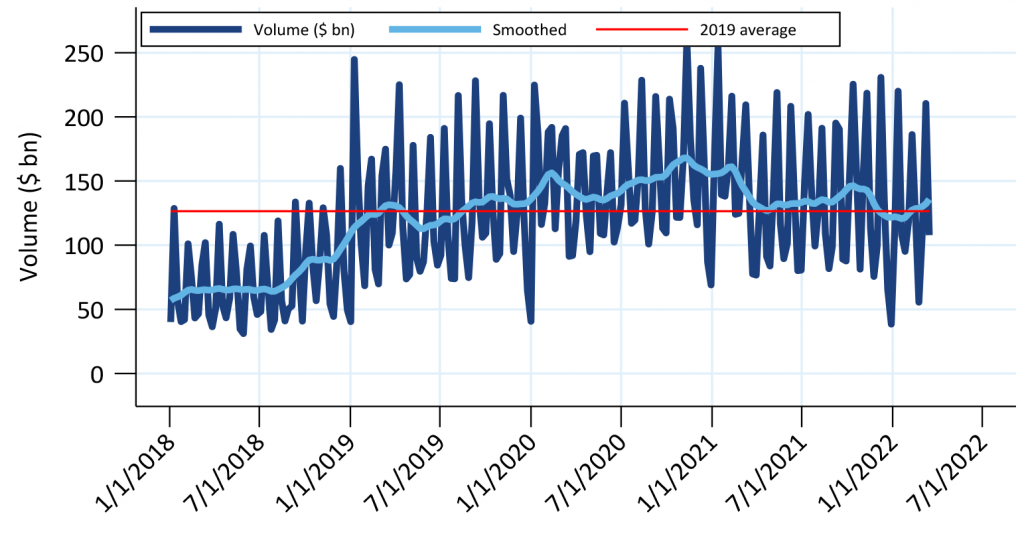
The dark blue line is weekly trading volume, the light blue is fit using LOESS to smooth seasonal variation.
Source: Federal Reserve, Amherst Pierpont Securities
The last time the Fed decided to shrink its MBS portfolio was in 2017 and 2018, which may have contributed to an increase in dollar roll usage in the second half of 2018 into 2019. The Fed started reducing its MBS portfolio balance in October 2017. Prior to that date, the Fed reinvested 100% of MBS paydowns into new MBS. Beginning in October the Fed permitted up to $4 billion of paydowns per month to run off their portfolio. Every quarter in 2018 the Fed increased the amount of MBS that it would permit to run off by an additional $4 billion per month, until reaching a maximum of $20 billion per month runoff in October 2018. Increases in the runoff cap decrease the Fed’s MBS purchases. In mid-2018 the Fed was purchasing less than $10 billion of MBS per month, and the amount fell below $1.0 billion per month starting in October 2018.
The pools the Fed would have bought were instead purchased by private investors. The Fed did not report any dollar roll transactions during that time, but it is likely that the private investors that replace the Fed’s MBS purchases would dollar roll. That would account for some of the increase in activity.
Dollar roll usage could increase similarly this year since the Fed is expected to allow its MBS portfolio to runoff. This process could start as soon as the May FOMC meeting. The Fed is likely to allow runoff of at least $30 billion a month since the MBS portfolio is larger than in 2017. And with a pressing need to combat inflation the Fed may need to ramp up to that cap quickly.
This material is intended only for institutional investors and does not carry all of the independence and disclosure standards of retail debt research reports. In the preparation of this material, the author may have consulted or otherwise discussed the matters referenced herein with one or more of SCM’s trading desks, any of which may have accumulated or otherwise taken a position, long or short, in any of the financial instruments discussed in or related to this material. Further, SCM may act as a market maker or principal dealer and may have proprietary interests that differ or conflict with the recipient hereof, in connection with any financial instrument discussed in or related to this material.
This message, including any attachments or links contained herein, is subject to important disclaimers, conditions, and disclosures regarding Electronic Communications, which you can find at https://portfolio-strategy.apsec.com/sancap-disclaimers-and-disclosures.
Important Disclaimers
Copyright © 2026 Santander US Capital Markets LLC and its affiliates (“SCM”). All rights reserved. SCM is a member of FINRA and SIPC. This material is intended for limited distribution to institutions only and is not publicly available. Any unauthorized use or disclosure is prohibited.
In making this material available, SCM (i) is not providing any advice to the recipient, including, without limitation, any advice as to investment, legal, accounting, tax and financial matters, (ii) is not acting as an advisor or fiduciary in respect of the recipient, (iii) is not making any predictions or projections and (iv) intends that any recipient to which SCM has provided this material is an “institutional investor” (as defined under applicable law and regulation, including FINRA Rule 4512 and that this material will not be disseminated, in whole or part, to any third party by the recipient.
The author of this material is an economist, desk strategist or trader. In the preparation of this material, the author may have consulted or otherwise discussed the matters referenced herein with one or more of SCM’s trading desks, any of which may have accumulated or otherwise taken a position, long or short, in any of the financial instruments discussed in or related to this material. Further, SCM or any of its affiliates may act as a market maker or principal dealer and may have proprietary interests that differ or conflict with the recipient hereof, in connection with any financial instrument discussed in or related to this material.
This material (i) has been prepared for information purposes only and does not constitute a solicitation or an offer to buy or sell any securities, related investments or other financial instruments, (ii) is neither research, a “research report” as commonly understood under the securities laws and regulations promulgated thereunder nor the product of a research department, (iii) or parts thereof may have been obtained from various sources, the reliability of which has not been verified and cannot be guaranteed by SCM, (iv) should not be reproduced or disclosed to any other person, without SCM’s prior consent and (v) is not intended for distribution in any jurisdiction in which its distribution would be prohibited.
In connection with this material, SCM (i) makes no representation or warranties as to the appropriateness or reliance for use in any transaction or as to the permissibility or legality of any financial instrument in any jurisdiction, (ii) believes the information in this material to be reliable, has not independently verified such information and makes no representation, express or implied, with regard to the accuracy or completeness of such information, (iii) accepts no responsibility or liability as to any reliance placed, or investment decision made, on the basis of such information by the recipient and (iv) does not undertake, and disclaims any duty to undertake, to update or to revise the information contained in this material.
Unless otherwise stated, the views, opinions, forecasts, valuations, or estimates contained in this material are those solely of the author, as of the date of publication of this material, and are subject to change without notice. The recipient of this material should make an independent evaluation of this information and make such other investigations as the recipient considers necessary (including obtaining independent financial advice), before transacting in any financial market or instrument discussed in or related to this material.
Important disclaimers for clients in the EU and UK
This publication has been prepared by Trading Desk Strategists within the Sales and Trading functions of Santander US Capital Markets LLC (“SanCap”), the US registered broker-dealer of Santander Corporate & Investment Banking. This communication is distributed in the EEA by Banco Santander S.A., a credit institution registered in Spain and authorised and regulated by the Bank of Spain and the CNMV. Any EEA recipient of this communication that would like to affect any transaction in any security or issuer discussed herein should do so with Banco Santander S.A. or any of its affiliates (together “Santander”). This communication has been distributed in the UK by Banco Santander, S.A.’s London branch, authorised by the Bank of Spain and subject to regulatory oversight on certain matters by the Financial Conduct Authority (FCA) and the Prudential Regulation Authority (PRA).
The publication is intended for exclusive use for Professional Clients and Eligible Counterparties as defined by MiFID II and is not intended for use by retail customers or for any persons or entities in any jurisdictions or country where such distribution or use would be contrary to local law or regulation.
This material is not a product of Santander´s Research Team and does not constitute independent investment research. This is a marketing communication and may contain ¨investment recommendations¨ as defined by the Market Abuse Regulation 596/2014 ("MAR"). This publication has not been prepared in accordance with legal requirements designed to promote the independence of research and is not subject to any prohibition on dealing ahead of the dissemination of investment research. The author, date and time of the production of this publication are as indicated herein.
This publication does not constitute investment advice and may not be relied upon to form an investment decision, nor should it be construed as any offer to sell or issue or invitation to purchase, acquire or subscribe for any instruments referred herein. The publication has been prepared in good faith and based on information Santander considers reliable as of the date of publication, but Santander does not guarantee or represent, express or implied, that such information is accurate or complete. All estimates, forecasts and opinions are current as at the date of this publication and are subject to change without notice. Unless otherwise indicated, Santander does not intend to update this publication. The views and commentary in this publication may not be objective or independent of the interests of the Trading and Sales functions of Santander, who may be active participants in the markets, investments or strategies referred to herein and/or may receive compensation from investment banking and non-investment banking services from entities mentioned herein. Santander may trade as principal, make a market or hold positions in instruments (or related derivatives) and/or hold financial interest in entities discussed herein. Santander may provide market commentary or trading strategies to other clients or engage in transactions which may differ from views expressed herein. Santander may have acted upon the contents of this publication prior to you having received it.
This publication is intended for the exclusive use of the recipient and must not be reproduced, redistributed or transmitted, in whole or in part, without Santander’s consent. The recipient agrees to keep confidential at all times information contained herein.


