The Long and Short
Omicron takes a bite out of DRI results
This material is a Marketing Communication and does not constitute Independent Investment Research.
Darden Restaurants’ (DRI) fiscal third quarter results came in below street estimates, and the high end of full year guidance was revised downward. Despite the Omicron driven headline weakness, sales and EBITDA margin are above pre-pandemic levels, indicating the company is managing inflation and staff shortages effectively. Through the recent volatility and spread widening in the credit market, DRI’s curve has steepened over the past month versus the consumer discretionary BBB index. This presents a good buying opportunity for DRI long bonds, particularly relative to peers SBUX and MCD.
Even with the highly transmissible Omicrom variant impacting guest demand and restaurant staffing, DRI’s consolidated sales were up 4.4% versus the company’s fiscal third quarter 2020 period (which ended February 23, 2020). Additionally, the company’s EBITDA margin of 16.1%, was up 50 bp from pre-COVID levels despite inflation of 7% in the quarter.
Exhibit 1. DRI vs. Consumer Discretionary BBB Curve (Today vs. 1 Month Ago)
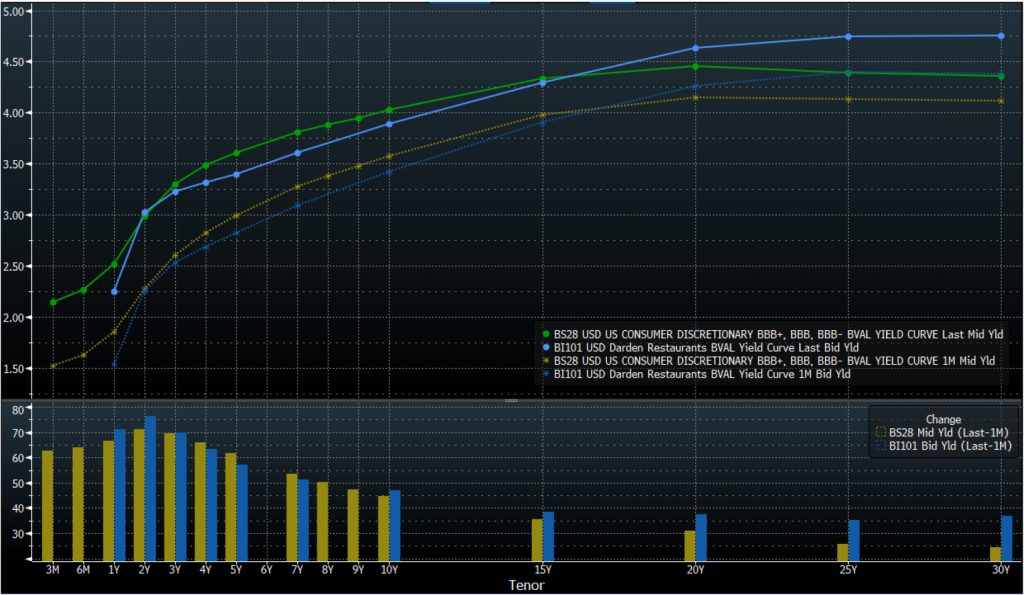
Source: Bloomberg TRACE; APS
The DRI 4.55% 2048 bonds are trading around the 230 bp area for a yield of roughly 4.87%. DRI long-dated paper offers a spread pick up of nearly 65 bp from SBUX 2048 bonds (Baa1/BBB+/BBB) and 75 bp from MCD 2048 bonds (Baa1/BBB+). Over the past month, MCD 2048 and SBUX 2048 paper tightened 13 bp and 17 bp respectively, while DRI 2048 paper remained flat on a spread basis.
Exhibit 2. DRI Average Weekly Sales
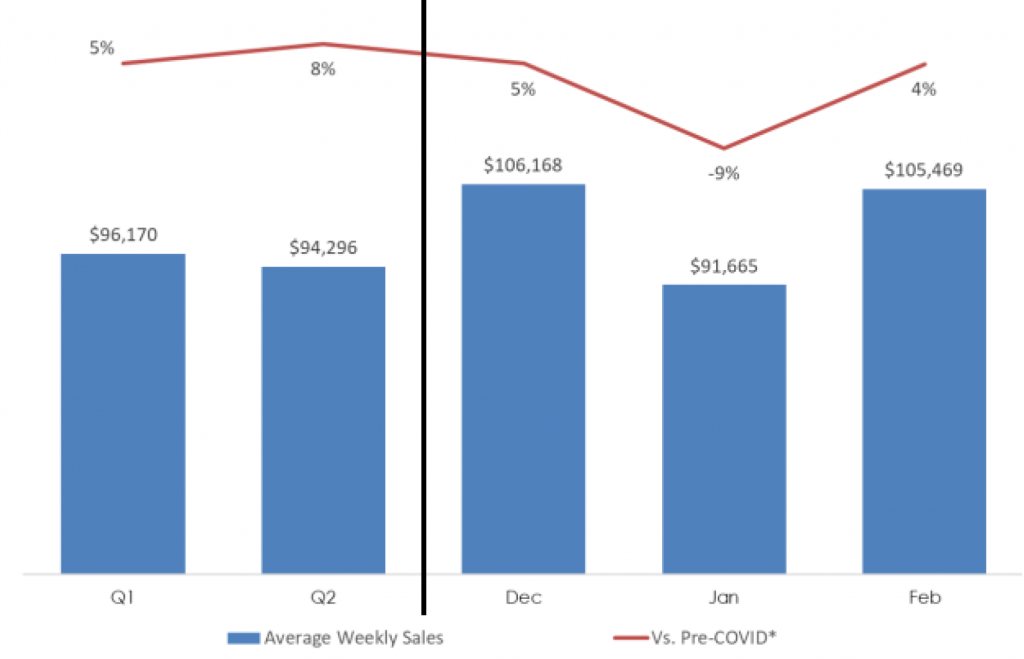
*Pre-COVID comparisons shown vs. FY20
Source: DRI Earnings Presentation
February Sales at Record Levels
DRI sales were negatively impacted in January as the Omicrom variant took hold (Exhibit 2), which greatly impacted restaurant traffic while causing staffing shortages. Average weekly sales were 9% below levels witnessed Pre-Covid, but quickly rebounded in February as pent up dining demand outweighed the spike in COVID cases. Management noted that sales in the month of February not only exceeded internal expectations, but were a record high for a fiscal February. Furthermore, March average weekly sales are outpacing February levels. The operating environment created by the dramatic spike in Omicrom cases was similar to the environment witnessed at the initial onset of COVID approximately two years ago. DRI witnessed high levels of sick pay and increased overtime costs due to staffing shortages, while supply chain disruptions helped to further exacerbate inflation. In fact, some restaurants were down as much as 40% of their staff, while others had to limit their hours of operation or move to take-out only in order to operate effectively. Given those headwinds, the EBITDA margin expansion of 50 bp versus pre-COVID levels is impressive.
Full Year Guidance Revised Downward but Strong Margin Growth Still Expected
DRI updated fiscal year 2022 guidance to reflect performance year-to-date as well as expected performance in the fiscal fourth quarter. Management lowered the high end of its sales range and now expects full year sales to be in the $9.55 billion-$9.62 billion range, down from previous guidance of $9.55 billion-$9.7 billion. This brings their same-restaurant sales growth range for the fiscal year to 29%-30%, versus a previous expectation of 29%-31%. Total sales growth from pre-COVID levels are expected to be in the 9%-10% range, with the high end of the range also reduced by a percentage point. Inflation, which was previously forecasted to be roughly 5.5% for the year, is now expected to be closer to 6%, with commodities inflation accounting for the increase. EBITDA was reduced as well, to a range of $1.53 billion-$1.55 billion (down from $1.55 billion-$1.6 billion), but full year-margin growth of 200 bp (versus pre-COVID levels) is still in line with management’s previous expectations. Additionally, the full year guidance implies a stronger fiscal fourth quarter than what was communicated on the prior earnings call.
Exhibit 3. DRI Updated Fiscal 2022 Outlook
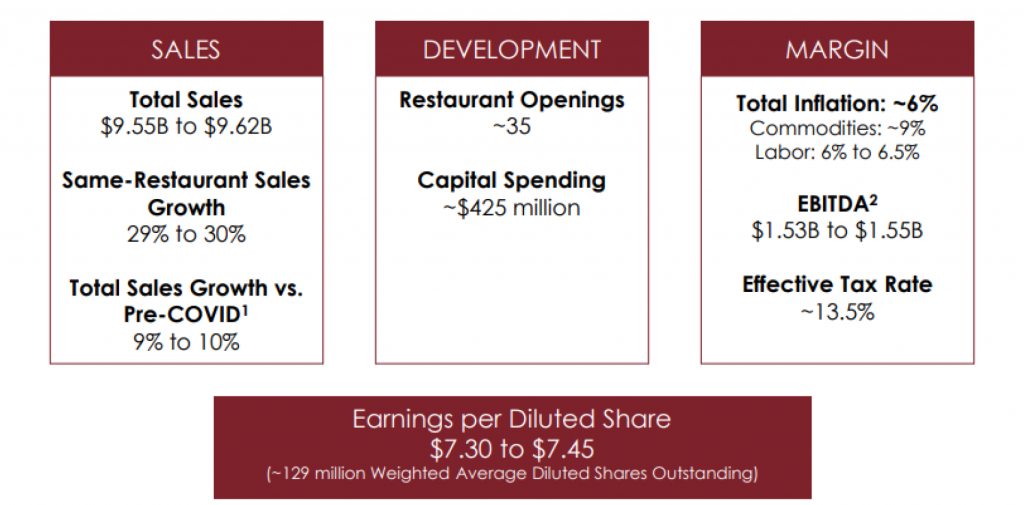
1 Comparison to twelve months ended fiscal 3Q20 due to impact of pandemic on fiscal 4Q20 and full year fiscal 2021 sales
2 Non-GAAP measure
Source: DRI Company Presentation
Balance Sheet Remains Strong
DRI ended the year with cash on hand of $555 million, which remains above average pre-COVID quarterly cash levels of roughly $300 million. While the company continues to return cash to shareholders via dividends and repurchases, shareholder remuneration is expected to remain largely within the confines of free cash flow generation. Management still targets lease-adjusted leverage within the 2.0x-2.5x range, and adjusted leverage is roughly 2.9x. Based on full-year EBITDA guidance, adjusted leverage should decline roughly a tick to 2.8x, with the potential to be at the high end of its target range sometime in fiscal 2023. DRI’s lease-adjusted leverage is currently flat to MCD’s, and compares favorably to SBUX, whose adjusted leverage is closer to 3.4x.
This material is intended only for institutional investors and does not carry all of the independence and disclosure standards of retail debt research reports. In the preparation of this material, the author may have consulted or otherwise discussed the matters referenced herein with one or more of SCM’s trading desks, any of which may have accumulated or otherwise taken a position, long or short, in any of the financial instruments discussed in or related to this material. Further, SCM may act as a market maker or principal dealer and may have proprietary interests that differ or conflict with the recipient hereof, in connection with any financial instrument discussed in or related to this material.
This message, including any attachments or links contained herein, is subject to important disclaimers, conditions, and disclosures regarding Electronic Communications, which you can find at https://portfolio-strategy.apsec.com/sancap-disclaimers-and-disclosures.
Important Disclaimers
Copyright © 2026 Santander US Capital Markets LLC and its affiliates (“SCM”). All rights reserved. SCM is a member of FINRA and SIPC. This material is intended for limited distribution to institutions only and is not publicly available. Any unauthorized use or disclosure is prohibited.
In making this material available, SCM (i) is not providing any advice to the recipient, including, without limitation, any advice as to investment, legal, accounting, tax and financial matters, (ii) is not acting as an advisor or fiduciary in respect of the recipient, (iii) is not making any predictions or projections and (iv) intends that any recipient to which SCM has provided this material is an “institutional investor” (as defined under applicable law and regulation, including FINRA Rule 4512 and that this material will not be disseminated, in whole or part, to any third party by the recipient.
The author of this material is an economist, desk strategist or trader. In the preparation of this material, the author may have consulted or otherwise discussed the matters referenced herein with one or more of SCM’s trading desks, any of which may have accumulated or otherwise taken a position, long or short, in any of the financial instruments discussed in or related to this material. Further, SCM or any of its affiliates may act as a market maker or principal dealer and may have proprietary interests that differ or conflict with the recipient hereof, in connection with any financial instrument discussed in or related to this material.
This material (i) has been prepared for information purposes only and does not constitute a solicitation or an offer to buy or sell any securities, related investments or other financial instruments, (ii) is neither research, a “research report” as commonly understood under the securities laws and regulations promulgated thereunder nor the product of a research department, (iii) or parts thereof may have been obtained from various sources, the reliability of which has not been verified and cannot be guaranteed by SCM, (iv) should not be reproduced or disclosed to any other person, without SCM’s prior consent and (v) is not intended for distribution in any jurisdiction in which its distribution would be prohibited.
In connection with this material, SCM (i) makes no representation or warranties as to the appropriateness or reliance for use in any transaction or as to the permissibility or legality of any financial instrument in any jurisdiction, (ii) believes the information in this material to be reliable, has not independently verified such information and makes no representation, express or implied, with regard to the accuracy or completeness of such information, (iii) accepts no responsibility or liability as to any reliance placed, or investment decision made, on the basis of such information by the recipient and (iv) does not undertake, and disclaims any duty to undertake, to update or to revise the information contained in this material.
Unless otherwise stated, the views, opinions, forecasts, valuations, or estimates contained in this material are those solely of the author, as of the date of publication of this material, and are subject to change without notice. The recipient of this material should make an independent evaluation of this information and make such other investigations as the recipient considers necessary (including obtaining independent financial advice), before transacting in any financial market or instrument discussed in or related to this material.
Important disclaimers for clients in the EU and UK
This publication has been prepared by Trading Desk Strategists within the Sales and Trading functions of Santander US Capital Markets LLC (“SanCap”), the US registered broker-dealer of Santander Corporate & Investment Banking. This communication is distributed in the EEA by Banco Santander S.A., a credit institution registered in Spain and authorised and regulated by the Bank of Spain and the CNMV. Any EEA recipient of this communication that would like to affect any transaction in any security or issuer discussed herein should do so with Banco Santander S.A. or any of its affiliates (together “Santander”). This communication has been distributed in the UK by Banco Santander, S.A.’s London branch, authorised by the Bank of Spain and subject to regulatory oversight on certain matters by the Financial Conduct Authority (FCA) and the Prudential Regulation Authority (PRA).
The publication is intended for exclusive use for Professional Clients and Eligible Counterparties as defined by MiFID II and is not intended for use by retail customers or for any persons or entities in any jurisdictions or country where such distribution or use would be contrary to local law or regulation.
This material is not a product of Santander´s Research Team and does not constitute independent investment research. This is a marketing communication and may contain ¨investment recommendations¨ as defined by the Market Abuse Regulation 596/2014 ("MAR"). This publication has not been prepared in accordance with legal requirements designed to promote the independence of research and is not subject to any prohibition on dealing ahead of the dissemination of investment research. The author, date and time of the production of this publication are as indicated herein.
This publication does not constitute investment advice and may not be relied upon to form an investment decision, nor should it be construed as any offer to sell or issue or invitation to purchase, acquire or subscribe for any instruments referred herein. The publication has been prepared in good faith and based on information Santander considers reliable as of the date of publication, but Santander does not guarantee or represent, express or implied, that such information is accurate or complete. All estimates, forecasts and opinions are current as at the date of this publication and are subject to change without notice. Unless otherwise indicated, Santander does not intend to update this publication. The views and commentary in this publication may not be objective or independent of the interests of the Trading and Sales functions of Santander, who may be active participants in the markets, investments or strategies referred to herein and/or may receive compensation from investment banking and non-investment banking services from entities mentioned herein. Santander may trade as principal, make a market or hold positions in instruments (or related derivatives) and/or hold financial interest in entities discussed herein. Santander may provide market commentary or trading strategies to other clients or engage in transactions which may differ from views expressed herein. Santander may have acted upon the contents of this publication prior to you having received it.
This publication is intended for the exclusive use of the recipient and must not be reproduced, redistributed or transmitted, in whole or in part, without Santander’s consent. The recipient agrees to keep confidential at all times information contained herein.


