The Long and Short
Longer corporates look vulnerable to further selling
This document is intended for institutional investors and is not subject to all of the independence and disclosure standards applicable to debt research reports prepared for retail investors. This material does not constitute research.
Since the Fed initiated its first rate hike since 2018 at the March FOMC meeting, Treasuries have continued to sell off in what is shaping up to be the worst quarterly bond rout since the early 1970s. The sell-off has been particularly harsh since late February, with the rate on US 10-year Treasuries rising by over 60 bp to its current level of roughly 2.45%. The curve has flattened aggressively during the sell-off, pushing the gap between 5- and 30-year maturities to its narrowest level in 15 years. Longer-maturity corporate debt looks vulnerable.
Exhibit 1. US Treasury Curve and IG Corporate Bond Yields – current vs year-end 2021

Source: Bloomberg LP
Investment grade corporate bond spreads have moved materially tighter since the first rate hike was initiated, and the investment grade index has tightened from a local peak level of 145 bp on March 14 to its current level of 123 bp over the past ten days. Similar to the yield curves, the long-end of the investment grade spread curve has gotten remarkably flat, with the difference between 10-year and 30-year corporate spreads now just over a single bp.
Exhibit 2. IG Corporate Bond Spread Curve – current vs year-end 2021

Source: Bloomberg LP
In addition to the concurrent market pressures, this spread curve flatness is at least partially due to recent supply and demand dynamics in the corporate primary market. Specifically, the aggregate duration of the investment grade index has dropped sharply year-to-date, moving from an aggregate option-adjusted duration of about 8.6 at year-end to its current level of just over 8.0 turns of duration (Exhibit 3). In fact, the measurement has actually moved back to the levels observed immediately prior to the Covid-19 pandemic. The index duration increased rapidly beginning in April of 2020, as corporate borrowers lined up to issue longer-term debt, with the support and back-stopping of US Federal Reserve, in order to firm up their balance sheet liquidity and term out their debt maturity schedules. This led to increased issuance of 30-year debt, which corporate bond investors have been more than willing to accommodate. This behavior from corporate management teams continued until the end of 2021. Since then, longer-dated debt issuance has tapered off as the heightened two-year period enabled most investment grade issuers to term out their debt and improve their capital structures. As a partial result, the current duration of the index appears to have returned to a more normalized level, and some of the pressure that has helped flatten the long-end of spread curve is expected to dissipate.
Exhibit 3. Option-adjusted duration of the IG corporate bond index
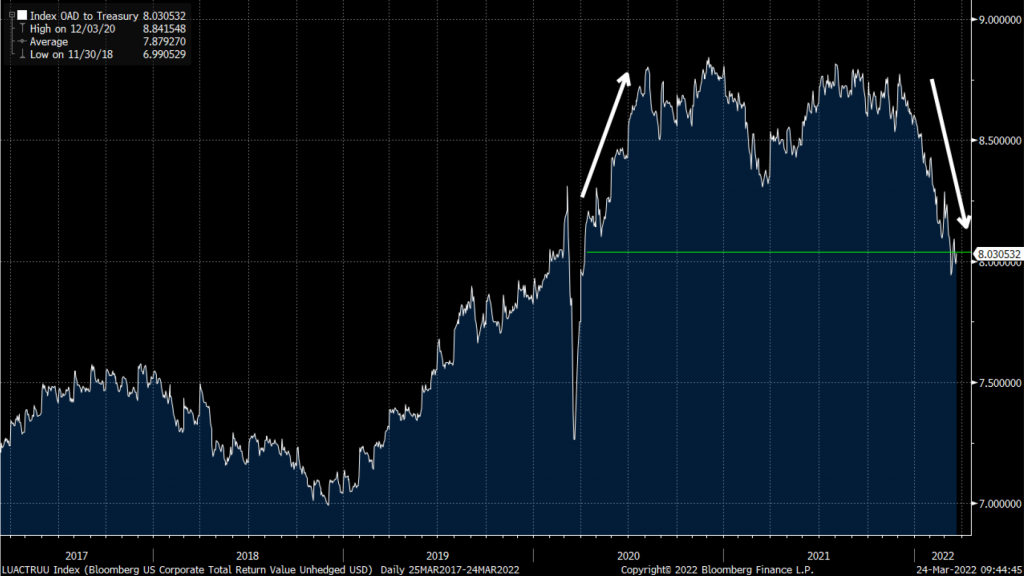
Source: Amherst Pierpont, Bloomberg LP, Bloomberg/Barclays US Corp Index
With the Fed poised to begin the dual tasks of continuing to hike rates while simultaneously shrinking its $9 trillion balance sheet, heavy selling in US Treasuries has begun to impact global markets. It seems likely that investors could soon demand higher and higher premiums to hold longer-dated debt, which could spur yield curve steepening off the current levels of historic flatness. Of course, my colleague, Steven Abrahams, has pointed out a range of factors that could further flatten and invert the yield curve. Time will tell.
Fed guidance on asset sales, or quantitative tightening, could come as early as next month when minutes from the March FOMC meeting are released. That could put the beginning of balance sheet runoff plans as early as May. Holders of long-dated investment grade corporate debt could be squeezed as the long end of the Treasury curve sells off in subsequent months. With effectively no spread premium to move out into 30-year corporate instruments, investors should be moving a greater allocation of holdings down the curve ahead of projected selling in long-dated US Treasuries.
This material is intended only for institutional investors and does not carry all of the independence and disclosure standards of retail debt research reports. In the preparation of this material, the author may have consulted or otherwise discussed the matters referenced herein with one or more of SCM’s trading desks, any of which may have accumulated or otherwise taken a position, long or short, in any of the financial instruments discussed in or related to this material. Further, SCM may act as a market maker or principal dealer and may have proprietary interests that differ or conflict with the recipient hereof, in connection with any financial instrument discussed in or related to this material.
This message, including any attachments or links contained herein, is subject to important disclaimers, conditions, and disclosures regarding Electronic Communications, which you can find at https://portfolio-strategy.apsec.com/sancap-disclaimers-and-disclosures.
Important Disclaimers
Copyright © 2024 Santander US Capital Markets LLC and its affiliates (“SCM”). All rights reserved. SCM is a member of FINRA and SIPC. This material is intended for limited distribution to institutions only and is not publicly available. Any unauthorized use or disclosure is prohibited.
In making this material available, SCM (i) is not providing any advice to the recipient, including, without limitation, any advice as to investment, legal, accounting, tax and financial matters, (ii) is not acting as an advisor or fiduciary in respect of the recipient, (iii) is not making any predictions or projections and (iv) intends that any recipient to which SCM has provided this material is an “institutional investor” (as defined under applicable law and regulation, including FINRA Rule 4512 and that this material will not be disseminated, in whole or part, to any third party by the recipient.
The author of this material is an economist, desk strategist or trader. In the preparation of this material, the author may have consulted or otherwise discussed the matters referenced herein with one or more of SCM’s trading desks, any of which may have accumulated or otherwise taken a position, long or short, in any of the financial instruments discussed in or related to this material. Further, SCM or any of its affiliates may act as a market maker or principal dealer and may have proprietary interests that differ or conflict with the recipient hereof, in connection with any financial instrument discussed in or related to this material.
This material (i) has been prepared for information purposes only and does not constitute a solicitation or an offer to buy or sell any securities, related investments or other financial instruments, (ii) is neither research, a “research report” as commonly understood under the securities laws and regulations promulgated thereunder nor the product of a research department, (iii) or parts thereof may have been obtained from various sources, the reliability of which has not been verified and cannot be guaranteed by SCM, (iv) should not be reproduced or disclosed to any other person, without SCM’s prior consent and (v) is not intended for distribution in any jurisdiction in which its distribution would be prohibited.
In connection with this material, SCM (i) makes no representation or warranties as to the appropriateness or reliance for use in any transaction or as to the permissibility or legality of any financial instrument in any jurisdiction, (ii) believes the information in this material to be reliable, has not independently verified such information and makes no representation, express or implied, with regard to the accuracy or completeness of such information, (iii) accepts no responsibility or liability as to any reliance placed, or investment decision made, on the basis of such information by the recipient and (iv) does not undertake, and disclaims any duty to undertake, to update or to revise the information contained in this material.
Unless otherwise stated, the views, opinions, forecasts, valuations, or estimates contained in this material are those solely of the author, as of the date of publication of this material, and are subject to change without notice. The recipient of this material should make an independent evaluation of this information and make such other investigations as the recipient considers necessary (including obtaining independent financial advice), before transacting in any financial market or instrument discussed in or related to this material.


