The Big Idea
Getting to the core of inflation
This material is a Marketing Communication and does not constitute Independent Investment Research.
The run-up in inflation in the spring of 2021 was mostly related to the reopening of the economy and reflected sharp advances in a handful of categories. In contrast, the surge in inflation over the past six months has been entirely different, driven by a broad array of line items. A close examination of the Dallas Fed’s trimmed-mean PCE inflation gauge illustrates the pervasiveness of inflation pressures. That gauge is likely shaping the Fed’s latest hawkish turn.
Dallas Fed trimmed-mean PCE measure
Economists came up with the notion of core inflation in the 1970s when food and energy prices skyrocketed. The idea was to strip out the volatile categories to get at some more accurate sense of underlying inflation pressures. However, it is arbitrary to work under the assumption that food and energy prices are always erratic and that everything else is always stable and an accurate indication of broader trends.
Economists at the Dallas Fed have since created a trimmed-mean PCE. Rather than assume food and energy prices are always the outliers, the trimmed-mean gauge lets the data decide. Each month, 177 items are ranked from lowest to highest in terms of percent change. Then based on research to optimize the fit between the trimmed-mean gauge and the more familiar core PCE deflator, categories are cast aside until the cumulative weight in the index of the discarded items adds up to 24% on the lower end and 31% on the higher end. It is important to highlight that each category is weighted by its contribution to the overall PCE deflator so that it is not a certain number of line items excluded but a cumulative share of the overall index.
The remaining items, which make up roughly the middle 45% of the weight of the index, are used to calculate the trimmed-mean index for each given month. The Dallas Fed reports the 1-month trimmed-mean inflation rate as an annualized figure and also calculates 6-month annualized and 12-month averages.
One-month percent change
The 1-month annualized percent change series for the Dallas Fed trimmed-mean PCE ran close to 2% before the pandemic, dipped for a brief time during the lockdowns, and then fluctuated around 2% into early 2021 (Exhibit 1). There was not a single monthly reading above 3% until August 2021. Recall that the core PCE deflator surged in the spring of last year, but it was driven by only a handful of categories linked to the economy’s reopening. In fact, the core PCE increased at an annualized rate of more than 5% for four straight months beginning in March 2021, but the trimmed mean gauge barely budged.
Exhibit 1: Dallas Fed trimmed-mean PCE 1-month annualized percent change
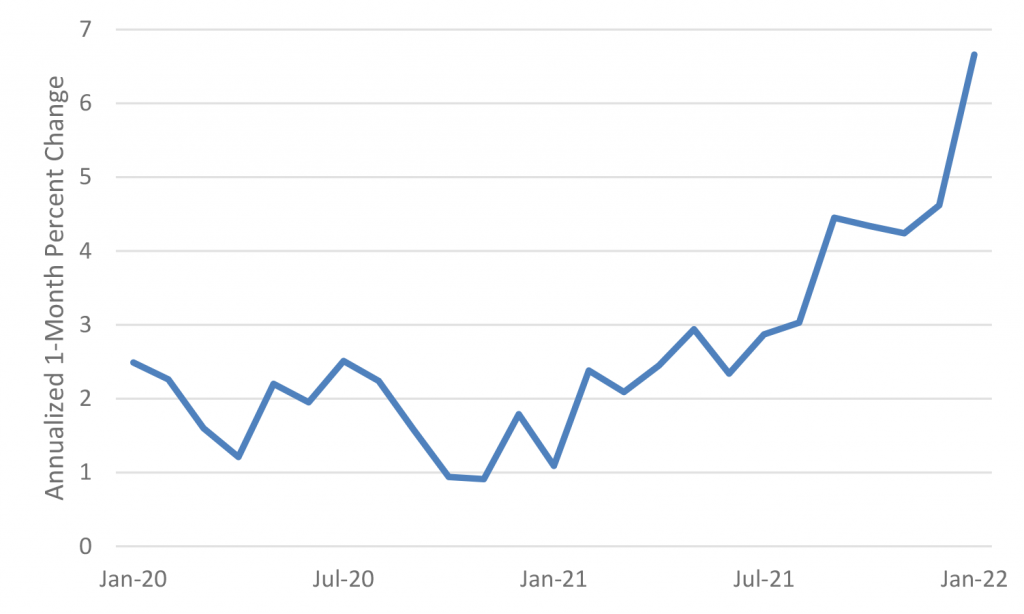
Source: Dallas Fed.
In contrast, the rise in core inflation that began in late 2021 was much more broadly based. The trimmed mean gauge on a 1-month basis jumped above 4% in September and surged to 6.7% in January, the highest reading since 1982.
One-month detail
The detailed breakdown for individual line items offers further insight into the breadth of inflation. Behind the Dallas Fed measure is a distribution of component price increases across a handful of buckets (Exhibit 2). A year ago, more than half the weight of the index consisted of categories with 1-month annualized inflation rates of less than 2% while about 30% of the cumulative weight of the index was posting annualized inflation rates over 5%. However, by January 2022, the latest available reading, just over 20% of the index came in at 2% or lower, while nearly 70% of the line items were running above 5%, including almost 40% above 10% and 14% over 20%.
Exhibit 2
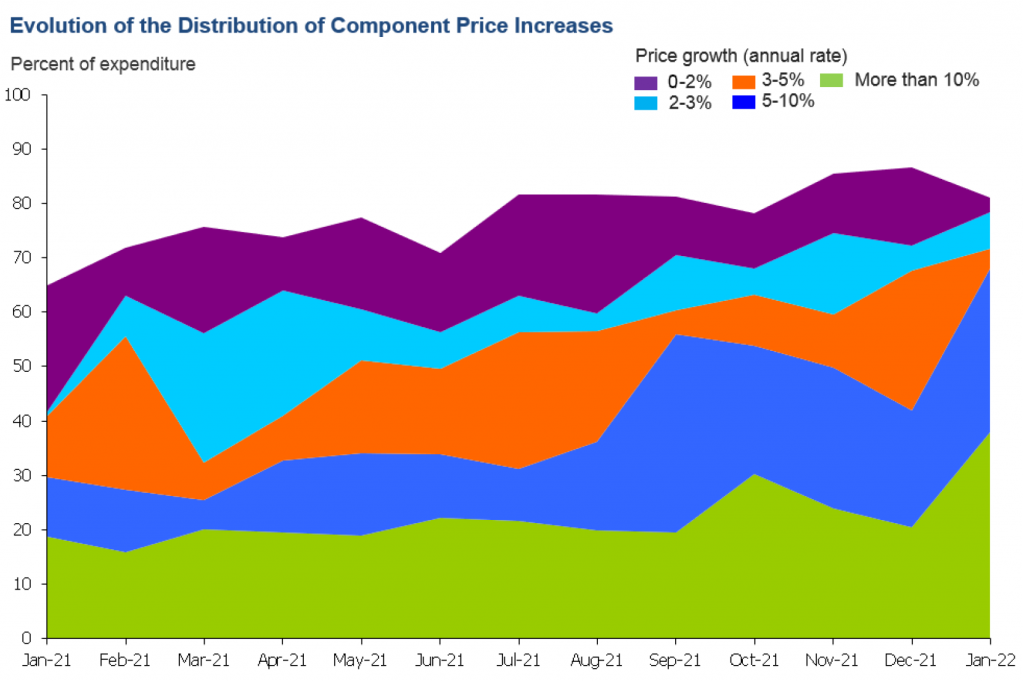
Source: Dallas Fed.
Trouble for the Fed
It is easy to understand how Fed officials were willing to write off the jump in inflation in the spring of 2021 as transitory since it was being driven by just a few categories. However, the recent surge in prices looks very different, sparking the abrupt turnaround, albeit belatedly, in the Fed’s monetary policy stance. The breadth of price increases points to economy-wide drivers of the acceleration in inflation, including steep wage hikes caused by an overheated labor market and an imbalance between supply and demand across major swaths of the economy.
The January headline and core PCE deflators in January were not meaningfully higher than the monthly readings in late 2021, but the trimmed-mean PCE gauge for the month spiked by almost 2 percentage points on an annualized basis. While the general public and even most market participants are largely unaware of the Dallas Fed data, Fed officials have for years followed them closely and were undoubtedly alarmed by what they saw for January. The widening breadth of inflation in January may help to explain the abrupt conversion of Fed officials from doves to hawks over the past few months and is likely to influence FOMC behavior for the foreseeable future.
This material is intended only for institutional investors and does not carry all of the independence and disclosure standards of retail debt research reports. In the preparation of this material, the author may have consulted or otherwise discussed the matters referenced herein with one or more of SCM’s trading desks, any of which may have accumulated or otherwise taken a position, long or short, in any of the financial instruments discussed in or related to this material. Further, SCM may act as a market maker or principal dealer and may have proprietary interests that differ or conflict with the recipient hereof, in connection with any financial instrument discussed in or related to this material.
This message, including any attachments or links contained herein, is subject to important disclaimers, conditions, and disclosures regarding Electronic Communications, which you can find at https://portfolio-strategy.apsec.com/sancap-disclaimers-and-disclosures.
Important Disclaimers
Copyright © 2026 Santander US Capital Markets LLC and its affiliates (“SCM”). All rights reserved. SCM is a member of FINRA and SIPC. This material is intended for limited distribution to institutions only and is not publicly available. Any unauthorized use or disclosure is prohibited.
In making this material available, SCM (i) is not providing any advice to the recipient, including, without limitation, any advice as to investment, legal, accounting, tax and financial matters, (ii) is not acting as an advisor or fiduciary in respect of the recipient, (iii) is not making any predictions or projections and (iv) intends that any recipient to which SCM has provided this material is an “institutional investor” (as defined under applicable law and regulation, including FINRA Rule 4512 and that this material will not be disseminated, in whole or part, to any third party by the recipient.
The author of this material is an economist, desk strategist or trader. In the preparation of this material, the author may have consulted or otherwise discussed the matters referenced herein with one or more of SCM’s trading desks, any of which may have accumulated or otherwise taken a position, long or short, in any of the financial instruments discussed in or related to this material. Further, SCM or any of its affiliates may act as a market maker or principal dealer and may have proprietary interests that differ or conflict with the recipient hereof, in connection with any financial instrument discussed in or related to this material.
This material (i) has been prepared for information purposes only and does not constitute a solicitation or an offer to buy or sell any securities, related investments or other financial instruments, (ii) is neither research, a “research report” as commonly understood under the securities laws and regulations promulgated thereunder nor the product of a research department, (iii) or parts thereof may have been obtained from various sources, the reliability of which has not been verified and cannot be guaranteed by SCM, (iv) should not be reproduced or disclosed to any other person, without SCM’s prior consent and (v) is not intended for distribution in any jurisdiction in which its distribution would be prohibited.
In connection with this material, SCM (i) makes no representation or warranties as to the appropriateness or reliance for use in any transaction or as to the permissibility or legality of any financial instrument in any jurisdiction, (ii) believes the information in this material to be reliable, has not independently verified such information and makes no representation, express or implied, with regard to the accuracy or completeness of such information, (iii) accepts no responsibility or liability as to any reliance placed, or investment decision made, on the basis of such information by the recipient and (iv) does not undertake, and disclaims any duty to undertake, to update or to revise the information contained in this material.
Unless otherwise stated, the views, opinions, forecasts, valuations, or estimates contained in this material are those solely of the author, as of the date of publication of this material, and are subject to change without notice. The recipient of this material should make an independent evaluation of this information and make such other investigations as the recipient considers necessary (including obtaining independent financial advice), before transacting in any financial market or instrument discussed in or related to this material.
Important disclaimers for clients in the EU and UK
This publication has been prepared by Trading Desk Strategists within the Sales and Trading functions of Santander US Capital Markets LLC (“SanCap”), the US registered broker-dealer of Santander Corporate & Investment Banking. This communication is distributed in the EEA by Banco Santander S.A., a credit institution registered in Spain and authorised and regulated by the Bank of Spain and the CNMV. Any EEA recipient of this communication that would like to affect any transaction in any security or issuer discussed herein should do so with Banco Santander S.A. or any of its affiliates (together “Santander”). This communication has been distributed in the UK by Banco Santander, S.A.’s London branch, authorised by the Bank of Spain and subject to regulatory oversight on certain matters by the Financial Conduct Authority (FCA) and the Prudential Regulation Authority (PRA).
The publication is intended for exclusive use for Professional Clients and Eligible Counterparties as defined by MiFID II and is not intended for use by retail customers or for any persons or entities in any jurisdictions or country where such distribution or use would be contrary to local law or regulation.
This material is not a product of Santander´s Research Team and does not constitute independent investment research. This is a marketing communication and may contain ¨investment recommendations¨ as defined by the Market Abuse Regulation 596/2014 ("MAR"). This publication has not been prepared in accordance with legal requirements designed to promote the independence of research and is not subject to any prohibition on dealing ahead of the dissemination of investment research. The author, date and time of the production of this publication are as indicated herein.
This publication does not constitute investment advice and may not be relied upon to form an investment decision, nor should it be construed as any offer to sell or issue or invitation to purchase, acquire or subscribe for any instruments referred herein. The publication has been prepared in good faith and based on information Santander considers reliable as of the date of publication, but Santander does not guarantee or represent, express or implied, that such information is accurate or complete. All estimates, forecasts and opinions are current as at the date of this publication and are subject to change without notice. Unless otherwise indicated, Santander does not intend to update this publication. The views and commentary in this publication may not be objective or independent of the interests of the Trading and Sales functions of Santander, who may be active participants in the markets, investments or strategies referred to herein and/or may receive compensation from investment banking and non-investment banking services from entities mentioned herein. Santander may trade as principal, make a market or hold positions in instruments (or related derivatives) and/or hold financial interest in entities discussed herein. Santander may provide market commentary or trading strategies to other clients or engage in transactions which may differ from views expressed herein. Santander may have acted upon the contents of this publication prior to you having received it.
This publication is intended for the exclusive use of the recipient and must not be reproduced, redistributed or transmitted, in whole or in part, without Santander’s consent. The recipient agrees to keep confidential at all times information contained herein.


