By the Numbers
Differences in mortgage rates help FHA, jumbo loans
This material is a Marketing Communication and does not constitute Independent Investment Research.
Mortgage rates have increased more than 125 bp this year, leaving only 6% of borrowers in conventional agency MBS pools 75 bp or more in-the-money to refinance and promising slower prepayment speeds. But rates have not increased as much for jumbo and FHA borrowers, according to mortgage rate lock data compiled by Black Knight’s Optimal Blue. Speeds for FHA and jumbo loans may fall less than conventional agency MBS borrowers since FHA and jumbo borrowers have less lock-in to their current loans. That should help lift purchase and cash-out prepayment speeds in FHA and jumbo loans, a benefit for MBS trading below par.
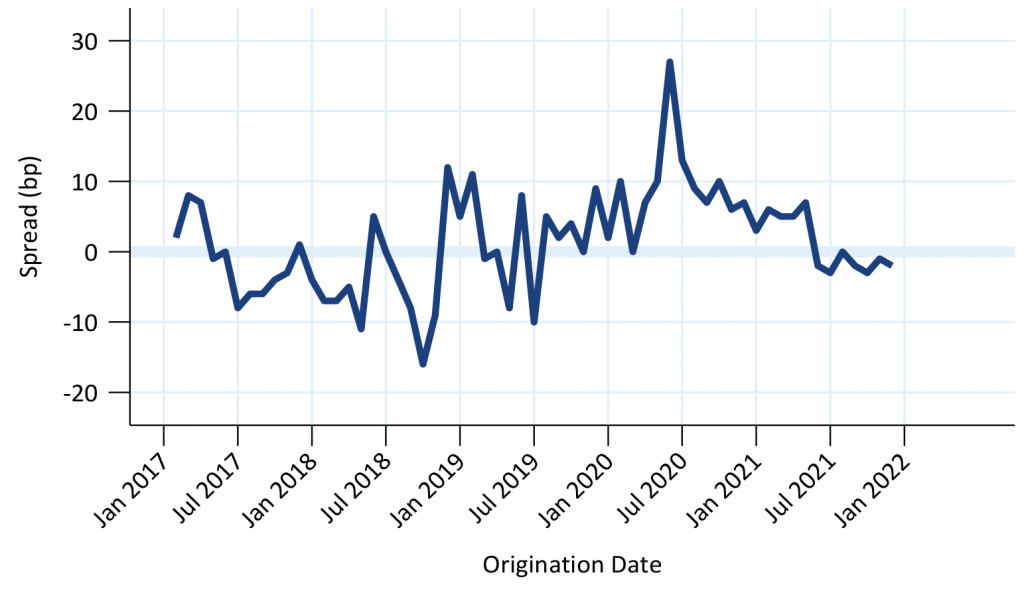
Conventional mortgage rates have reached 4.71% while jumbo rates are only 4.28%, according to Optimal Blue’s mortgage rate lock data (Exhibit 1). The two rates were similar at the start of 2020, but the pandemic disrupted the market for private label securitizations (PLS) and sent jumbo rates higher. The jumbo rate stayed higher than the conventional rate until late 2020, when the two rates converged as the PLS market recovered. The two rates were similar for most of 2021. However, over the last few months jumbo rates have not increased as much as conventional rates and are currently 43 bp lower than conventional.
Exhibit 1. Conventional rates increased more than jumbo rates this year
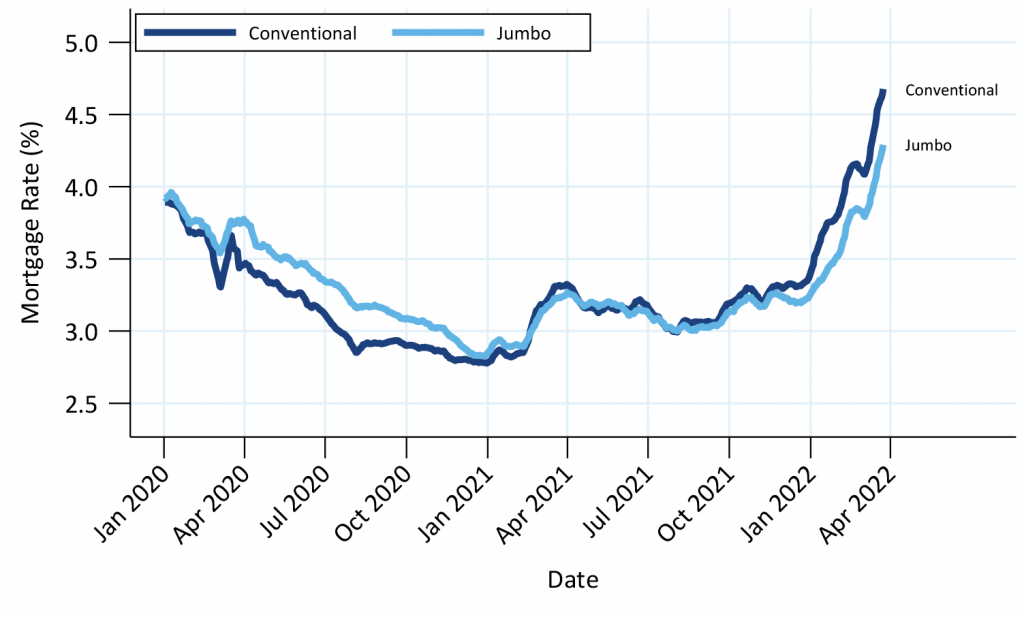
The conventional mortgage rate includes all agency-conforming loan balances, including jumbo conforming. The jumbo rate includes only loans with balances larger than agency limits.
Source: Optimal Blue, Amherst Pierpont Securities
Even borrowers that are out-of-the-money to refinance have some sensitivity to mortgage rates. Borrowers are more reluctant to move or do a cash-out refinance if the new loan will have a higher interest rate. Some borrowers will be unable to avoid a move. Others will decide that a cash-out refinance to assist with debt consolidation is still more sensible than paying high credit card interest rates. But borrowers that can defer a new home purchase or don’t need the cash will not prepay. This effect is known as lock-in.
The jumbo-to-conventional spread has fallen below the VA-to-conventional spread (Exhibit 2). Originators typically offer VA loans at lower rates than other products since the loan is guaranteed by the Department of Veterans Affairs. This allows Ginnie Mae to charge a much lower guaranty fee than Fannie Mae and Freddie Mac. FHA borrowers typically have worse credit than VA borrowers; even though the loan is insured by the FHA, the servicer can face higher costs dealing with delinquent loans. Over the last year FHA loans were typically up to 10 bp higher than conventional, but recently have fallen below conventional rates.
Exhibit 2. FHA, VA, and jumbo spreads to conventional
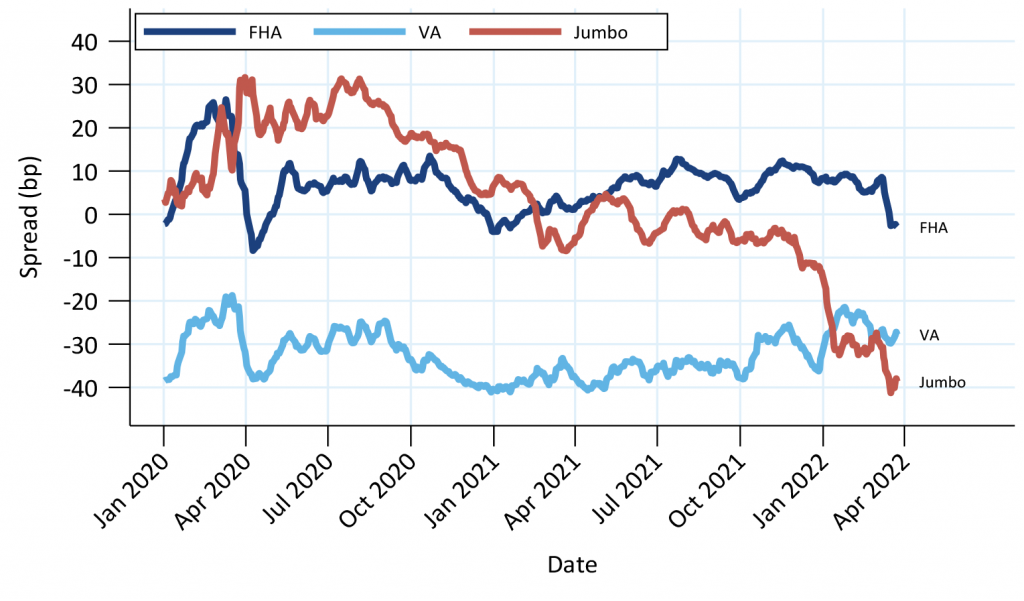
Spreads vs. conventional mortgage rate. The conventional mortgage rate includes all agency-conforming loan balances, including jumbo conforming. The jumbo rate includes only loans with balances larger than agency limits.
Source: Optimal Blue, Amherst Pierpont Securities
Borrowers with weak credit typically get higher rates. The rate premium helps the borrower pay upfront credit fees charged by Fannie Mae and Freddie Mac and any additional fees charged by lenders. But credit spreads have generally tightened since mid-2021 (Exhibit 3). Spreads for borrowers with credit scores below 720 have been volatile this year, but recently have fallen to a 2-year low. Spreads are 5 bp to 10 bp lower than at the start of 2020. Low FICO loans typically prepay faster than high FICO loans when they are out-of-the-money and having rate spreads compress should help.
Exhibit 3. Rate premiums for lower credit borrowers have fallen
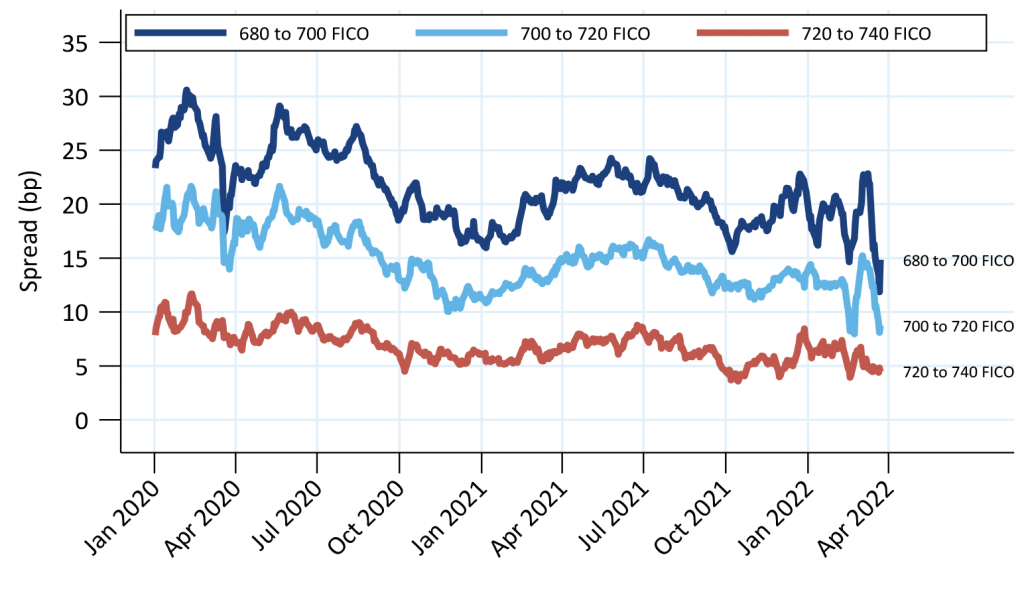
Source: Optimal Blue, Amherst Pierpont Securities
The rate lock data is a good predictor of the average rate received by conventional borrowers (Exhibit 4). This chart compares the spread between loans issued in new Fannie Mae and Freddie Mac pools to the average rate conventional rate lock series. The rate lock data is shifted to account for the lag between lock and closing. With only a few exceptions the spread was less than ±5 bp since the start of 2017.
Exhibit 4. Spread between conventional rate locks and conventional origination
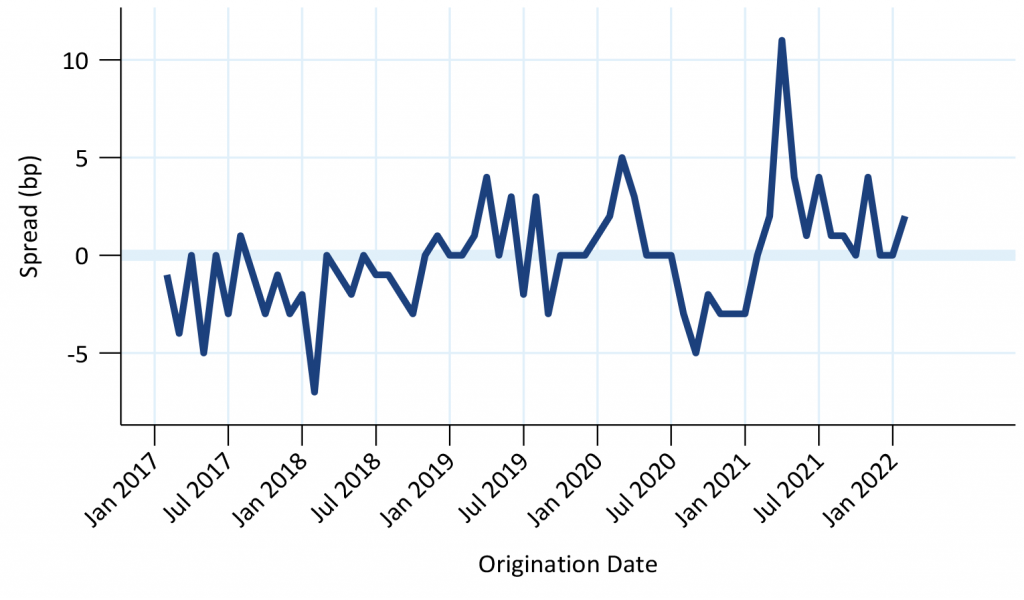
Source: Optimal Blue, Amherst Pierpont Securities
The jumbo rate lock data has also been a good predictor of the note rate of loans in prime jumbo 2.0 securities (Exhibit 5). The spread has typically been less than 10 bp, so also appears to be a good indicator of the current jumbo mortgage rate.
Exhibit 5. Spread between jumbo rate locks and originations in prime jumbo 2.0 securities
Source: Optimal Blue, Amherst Pierpont Securities
This material is intended only for institutional investors and does not carry all of the independence and disclosure standards of retail debt research reports. In the preparation of this material, the author may have consulted or otherwise discussed the matters referenced herein with one or more of SCM’s trading desks, any of which may have accumulated or otherwise taken a position, long or short, in any of the financial instruments discussed in or related to this material. Further, SCM may act as a market maker or principal dealer and may have proprietary interests that differ or conflict with the recipient hereof, in connection with any financial instrument discussed in or related to this material.
This message, including any attachments or links contained herein, is subject to important disclaimers, conditions, and disclosures regarding Electronic Communications, which you can find at https://portfolio-strategy.apsec.com/sancap-disclaimers-and-disclosures.
Important Disclaimers
Copyright © 2026 Santander US Capital Markets LLC and its affiliates (“SCM”). All rights reserved. SCM is a member of FINRA and SIPC. This material is intended for limited distribution to institutions only and is not publicly available. Any unauthorized use or disclosure is prohibited.
In making this material available, SCM (i) is not providing any advice to the recipient, including, without limitation, any advice as to investment, legal, accounting, tax and financial matters, (ii) is not acting as an advisor or fiduciary in respect of the recipient, (iii) is not making any predictions or projections and (iv) intends that any recipient to which SCM has provided this material is an “institutional investor” (as defined under applicable law and regulation, including FINRA Rule 4512 and that this material will not be disseminated, in whole or part, to any third party by the recipient.
The author of this material is an economist, desk strategist or trader. In the preparation of this material, the author may have consulted or otherwise discussed the matters referenced herein with one or more of SCM’s trading desks, any of which may have accumulated or otherwise taken a position, long or short, in any of the financial instruments discussed in or related to this material. Further, SCM or any of its affiliates may act as a market maker or principal dealer and may have proprietary interests that differ or conflict with the recipient hereof, in connection with any financial instrument discussed in or related to this material.
This material (i) has been prepared for information purposes only and does not constitute a solicitation or an offer to buy or sell any securities, related investments or other financial instruments, (ii) is neither research, a “research report” as commonly understood under the securities laws and regulations promulgated thereunder nor the product of a research department, (iii) or parts thereof may have been obtained from various sources, the reliability of which has not been verified and cannot be guaranteed by SCM, (iv) should not be reproduced or disclosed to any other person, without SCM’s prior consent and (v) is not intended for distribution in any jurisdiction in which its distribution would be prohibited.
In connection with this material, SCM (i) makes no representation or warranties as to the appropriateness or reliance for use in any transaction or as to the permissibility or legality of any financial instrument in any jurisdiction, (ii) believes the information in this material to be reliable, has not independently verified such information and makes no representation, express or implied, with regard to the accuracy or completeness of such information, (iii) accepts no responsibility or liability as to any reliance placed, or investment decision made, on the basis of such information by the recipient and (iv) does not undertake, and disclaims any duty to undertake, to update or to revise the information contained in this material.
Unless otherwise stated, the views, opinions, forecasts, valuations, or estimates contained in this material are those solely of the author, as of the date of publication of this material, and are subject to change without notice. The recipient of this material should make an independent evaluation of this information and make such other investigations as the recipient considers necessary (including obtaining independent financial advice), before transacting in any financial market or instrument discussed in or related to this material.
Important disclaimers for clients in the EU and UK
This publication has been prepared by Trading Desk Strategists within the Sales and Trading functions of Santander US Capital Markets LLC (“SanCap”), the US registered broker-dealer of Santander Corporate & Investment Banking. This communication is distributed in the EEA by Banco Santander S.A., a credit institution registered in Spain and authorised and regulated by the Bank of Spain and the CNMV. Any EEA recipient of this communication that would like to affect any transaction in any security or issuer discussed herein should do so with Banco Santander S.A. or any of its affiliates (together “Santander”). This communication has been distributed in the UK by Banco Santander, S.A.’s London branch, authorised by the Bank of Spain and subject to regulatory oversight on certain matters by the Financial Conduct Authority (FCA) and the Prudential Regulation Authority (PRA).
The publication is intended for exclusive use for Professional Clients and Eligible Counterparties as defined by MiFID II and is not intended for use by retail customers or for any persons or entities in any jurisdictions or country where such distribution or use would be contrary to local law or regulation.
This material is not a product of Santander´s Research Team and does not constitute independent investment research. This is a marketing communication and may contain ¨investment recommendations¨ as defined by the Market Abuse Regulation 596/2014 ("MAR"). This publication has not been prepared in accordance with legal requirements designed to promote the independence of research and is not subject to any prohibition on dealing ahead of the dissemination of investment research. The author, date and time of the production of this publication are as indicated herein.
This publication does not constitute investment advice and may not be relied upon to form an investment decision, nor should it be construed as any offer to sell or issue or invitation to purchase, acquire or subscribe for any instruments referred herein. The publication has been prepared in good faith and based on information Santander considers reliable as of the date of publication, but Santander does not guarantee or represent, express or implied, that such information is accurate or complete. All estimates, forecasts and opinions are current as at the date of this publication and are subject to change without notice. Unless otherwise indicated, Santander does not intend to update this publication. The views and commentary in this publication may not be objective or independent of the interests of the Trading and Sales functions of Santander, who may be active participants in the markets, investments or strategies referred to herein and/or may receive compensation from investment banking and non-investment banking services from entities mentioned herein. Santander may trade as principal, make a market or hold positions in instruments (or related derivatives) and/or hold financial interest in entities discussed herein. Santander may provide market commentary or trading strategies to other clients or engage in transactions which may differ from views expressed herein. Santander may have acted upon the contents of this publication prior to you having received it.
This publication is intended for the exclusive use of the recipient and must not be reproduced, redistributed or transmitted, in whole or in part, without Santander’s consent. The recipient agrees to keep confidential at all times information contained herein.


