The Long and Short
The path of corporate bond spreads as the Fed tightens
This material is a Marketing Communication and does not constitute Independent Investment Research.
The Fed this week finally delivered its first rate hike since late 2018, moving the lower bound of the fed funds rate from 0% to 0.25%. The FOMC’s median dot plot shifted hawkishly, factoring in the likelihood of seven rate hikes for the remainder of 2022 and roughly catching up with market pricing. Cycles of Fed tightening since 1990 show how the investment grade corporate credit market has behaved. And history suggests corporate credit should do well.
Exhibit 1. Fed tightening cycles over the past 30+ years
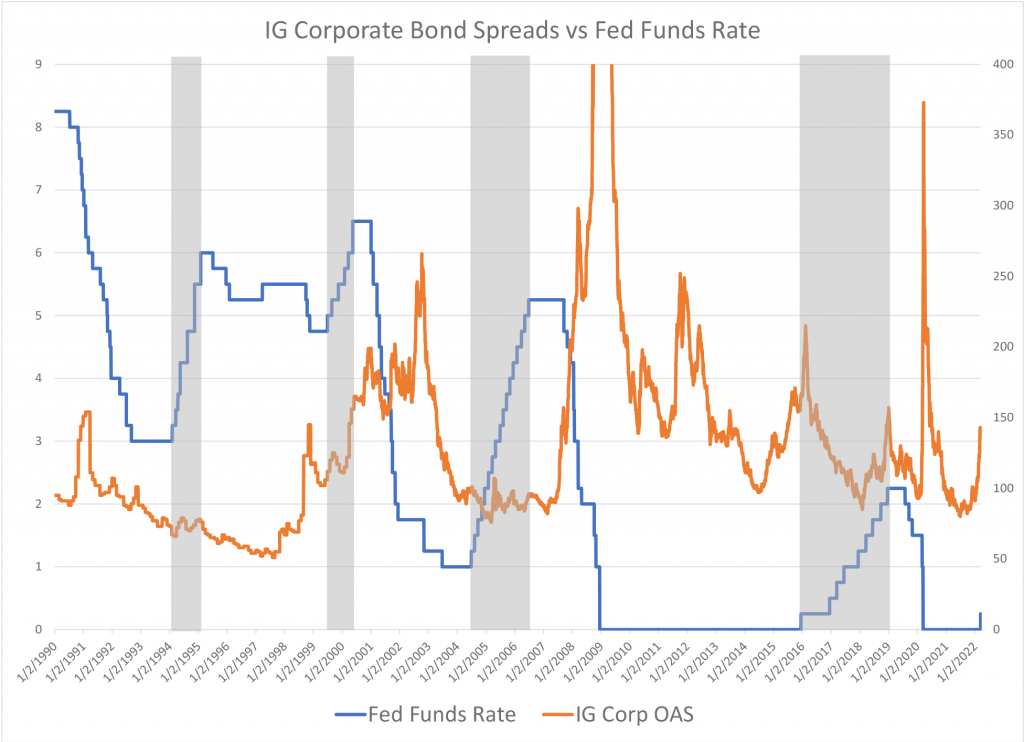
Source: Amherst Pierpont, Bloomberg LP, Bloomberg/Barclays US Corp Index
There have been four tightening cycles since the beginning of 1990, all depicted in the gray shaded areas on Exhibit 1. All of the tightening cycles illustrated during this time period consist of six or more Fed rate hikes. A quick observation over history is that investment grade corporate bond spreads typically trend tighter during the earlier phases of rate hikes; which is somewhat intuitive as a period of tightening would likely be immediately preceded by a constructive period for corporate credit and relative economic stability. As the Fed gets further into their tightening schedule, bond spreads may become less predictable, and sometimes widen – after either brushing up against historic tights or seeing the environment for corporate credit weaken amidst rising rates.
The four more recent tightening trends depicted in the graph exhibit mixed behavior as rate hikes are implemented over each of their respective time periods. The first of these periods begins on February 4, 1994 with a rate move to 3.25% from 3.00% and concludes on February 1, 1995 with the fed funds rate peaking at 6.00%. During this roughly one-year period, investment grade corporate bond spreads moved mostly sideways, trading within a short band over the year and concluding with spreads slightly wide of where they started.
The second tightening cycle on the graph begins on June 30, 1999 with a rate move to 5.00% from 4.75% and concludes on May 16, 2000 with rates peaking at 6.50%. During this stretch, bond spreads moved mostly wider, in particular during the latter portion of the Fed’s activity to move rates higher. The investment grade corporate bond index moved from an aggregate option-adjusted spread of about 106 bp to 156 bp during this period.
Perhaps the most iconic Fed tightening to take place over the course of the past 30 years was the cycle almost immediately preceding the financial crisis. During this stretch, the FOMC took the fed funds rate from 1.00% on Jun 29, 2004 to 5.25% by June 29, 2006 over the course of 17 rate hikes during that two-year period. As is historically typical, spreads traded tighter during the earlier rate moves but then traded mostly sideways. The investment grade index traded within a fairly narrow band throughout the remainder of the cycle, until the first phase of the financial crisis struck and sent spreads spiraling wider.
Exhibit 2. The Fed’s most recent tightening cycle (2015-2018)
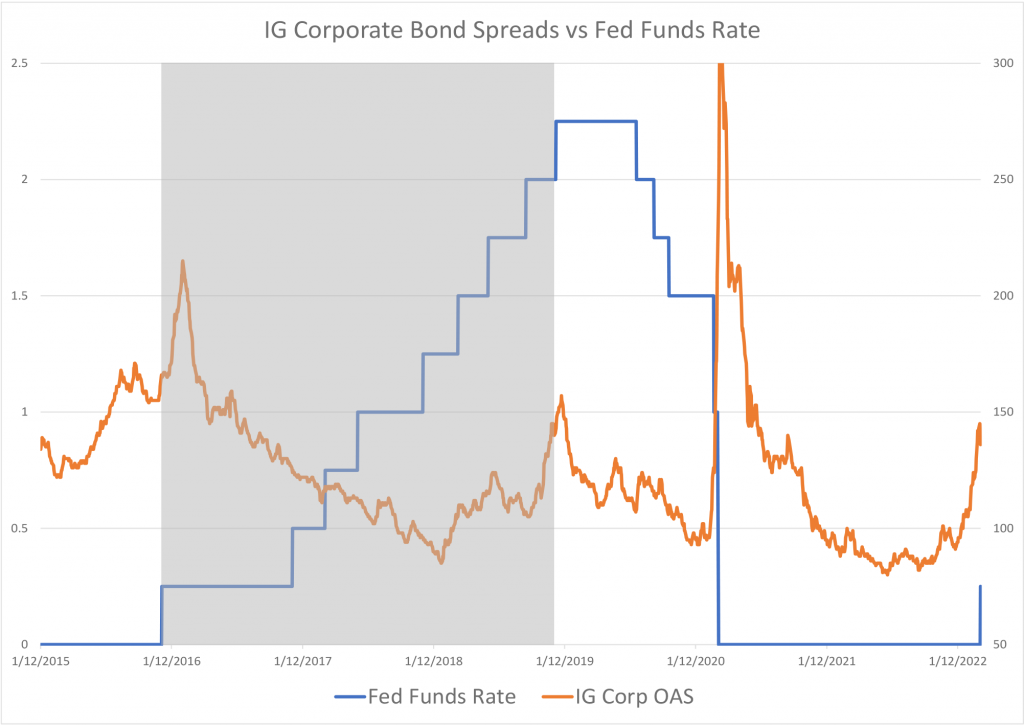
Source: Amherst Pierpont, Bloomberg LP, Bloomberg/Barclays US Corp Index
A closer look at the Fed’s most recent tightening cycle is depicted in Exhibit 2. There were nine rate hikes beginning on December 16, 2015 and concluding on December 19, 2018, moving the fed funds rate in aggregate from 0.00% to 2.25%. This particular cycle is worth noting, as investment grade corporate bond spreads had been moving mostly wider since mid-2014, reaching a peak only shortly after the first Fed rate hike was implemented. This is a similar dynamic to what is currently occurring, and could lend perspective on what lies ahead for corporate credit. Notwithstanding the heightened geopolitical risk, investment grade corporate bond spreads are poised to tighten over the course of the next several rates moves from the FOMC throughout 2022. During the 2015-2018 tightening trend, the investment grade corporate bond index produced an aggregate total return of 10.65% and an excess return (credit return net of Treasuries) of 8.27%. From the wide print for the corporate bond index on February 12, 2016 to the tight print on February 1, 2018, the index produced a total return of 10.95% and an excess return of 13.89%.
This material is intended only for institutional investors and does not carry all of the independence and disclosure standards of retail debt research reports. In the preparation of this material, the author may have consulted or otherwise discussed the matters referenced herein with one or more of SCM’s trading desks, any of which may have accumulated or otherwise taken a position, long or short, in any of the financial instruments discussed in or related to this material. Further, SCM may act as a market maker or principal dealer and may have proprietary interests that differ or conflict with the recipient hereof, in connection with any financial instrument discussed in or related to this material.
This message, including any attachments or links contained herein, is subject to important disclaimers, conditions, and disclosures regarding Electronic Communications, which you can find at https://portfolio-strategy.apsec.com/sancap-disclaimers-and-disclosures.
Important Disclaimers
Copyright © 2026 Santander US Capital Markets LLC and its affiliates (“SCM”). All rights reserved. SCM is a member of FINRA and SIPC. This material is intended for limited distribution to institutions only and is not publicly available. Any unauthorized use or disclosure is prohibited.
In making this material available, SCM (i) is not providing any advice to the recipient, including, without limitation, any advice as to investment, legal, accounting, tax and financial matters, (ii) is not acting as an advisor or fiduciary in respect of the recipient, (iii) is not making any predictions or projections and (iv) intends that any recipient to which SCM has provided this material is an “institutional investor” (as defined under applicable law and regulation, including FINRA Rule 4512 and that this material will not be disseminated, in whole or part, to any third party by the recipient.
The author of this material is an economist, desk strategist or trader. In the preparation of this material, the author may have consulted or otherwise discussed the matters referenced herein with one or more of SCM’s trading desks, any of which may have accumulated or otherwise taken a position, long or short, in any of the financial instruments discussed in or related to this material. Further, SCM or any of its affiliates may act as a market maker or principal dealer and may have proprietary interests that differ or conflict with the recipient hereof, in connection with any financial instrument discussed in or related to this material.
This material (i) has been prepared for information purposes only and does not constitute a solicitation or an offer to buy or sell any securities, related investments or other financial instruments, (ii) is neither research, a “research report” as commonly understood under the securities laws and regulations promulgated thereunder nor the product of a research department, (iii) or parts thereof may have been obtained from various sources, the reliability of which has not been verified and cannot be guaranteed by SCM, (iv) should not be reproduced or disclosed to any other person, without SCM’s prior consent and (v) is not intended for distribution in any jurisdiction in which its distribution would be prohibited.
In connection with this material, SCM (i) makes no representation or warranties as to the appropriateness or reliance for use in any transaction or as to the permissibility or legality of any financial instrument in any jurisdiction, (ii) believes the information in this material to be reliable, has not independently verified such information and makes no representation, express or implied, with regard to the accuracy or completeness of such information, (iii) accepts no responsibility or liability as to any reliance placed, or investment decision made, on the basis of such information by the recipient and (iv) does not undertake, and disclaims any duty to undertake, to update or to revise the information contained in this material.
Unless otherwise stated, the views, opinions, forecasts, valuations, or estimates contained in this material are those solely of the author, as of the date of publication of this material, and are subject to change without notice. The recipient of this material should make an independent evaluation of this information and make such other investigations as the recipient considers necessary (including obtaining independent financial advice), before transacting in any financial market or instrument discussed in or related to this material.
Important disclaimers for clients in the EU and UK
This publication has been prepared by Trading Desk Strategists within the Sales and Trading functions of Santander US Capital Markets LLC (“SanCap”), the US registered broker-dealer of Santander Corporate & Investment Banking. This communication is distributed in the EEA by Banco Santander S.A., a credit institution registered in Spain and authorised and regulated by the Bank of Spain and the CNMV. Any EEA recipient of this communication that would like to affect any transaction in any security or issuer discussed herein should do so with Banco Santander S.A. or any of its affiliates (together “Santander”). This communication has been distributed in the UK by Banco Santander, S.A.’s London branch, authorised by the Bank of Spain and subject to regulatory oversight on certain matters by the Financial Conduct Authority (FCA) and the Prudential Regulation Authority (PRA).
The publication is intended for exclusive use for Professional Clients and Eligible Counterparties as defined by MiFID II and is not intended for use by retail customers or for any persons or entities in any jurisdictions or country where such distribution or use would be contrary to local law or regulation.
This material is not a product of Santander´s Research Team and does not constitute independent investment research. This is a marketing communication and may contain ¨investment recommendations¨ as defined by the Market Abuse Regulation 596/2014 ("MAR"). This publication has not been prepared in accordance with legal requirements designed to promote the independence of research and is not subject to any prohibition on dealing ahead of the dissemination of investment research. The author, date and time of the production of this publication are as indicated herein.
This publication does not constitute investment advice and may not be relied upon to form an investment decision, nor should it be construed as any offer to sell or issue or invitation to purchase, acquire or subscribe for any instruments referred herein. The publication has been prepared in good faith and based on information Santander considers reliable as of the date of publication, but Santander does not guarantee or represent, express or implied, that such information is accurate or complete. All estimates, forecasts and opinions are current as at the date of this publication and are subject to change without notice. Unless otherwise indicated, Santander does not intend to update this publication. The views and commentary in this publication may not be objective or independent of the interests of the Trading and Sales functions of Santander, who may be active participants in the markets, investments or strategies referred to herein and/or may receive compensation from investment banking and non-investment banking services from entities mentioned herein. Santander may trade as principal, make a market or hold positions in instruments (or related derivatives) and/or hold financial interest in entities discussed herein. Santander may provide market commentary or trading strategies to other clients or engage in transactions which may differ from views expressed herein. Santander may have acted upon the contents of this publication prior to you having received it.
This publication is intended for the exclusive use of the recipient and must not be reproduced, redistributed or transmitted, in whole or in part, without Santander’s consent. The recipient agrees to keep confidential at all times information contained herein.


