By the Numbers
The state of the SFR securitization market
This material is a Marketing Communication and does not constitute Independent Investment Research.
The strong fundamentals of the SFR sector have contributed to somewhat lower volatility and less spread widening than seen in some other products. The ‘AAA’ classes of SFR deals, which are typically issued with 5- to 7-year average life, continue to trade steadily in the 50 bp to 90 bp range over swaps. These classes did look inexpensive relative to agency CMBS when those spreads were at their tights, but now appear closer to fair value since the substantial widening in Ks and DUS. Overall, the depth and liquidity of the SFR market has improved during the pandemic.
The pace of SFR issuance accelerated in 2020 and 2021 as operators expanded their portfolios in response to strong housing fundamentals (Exhibit 1). Before 2020, SFR issuance averaged $5.25 billion a year. Total issuance grew to $10 billion in 2020, then nearly $18 billion in 2021 as the number of new deals brought to market tripled from 9 in 2019 to 27 in 2022. The average deal size also grew by 24% from $532 million before the pandemic to $660 million in 2022.
Exhibit 1: Single-family rental securitizations (new issuance)
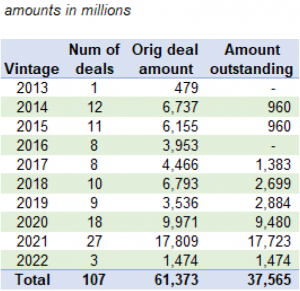
Note: Data through 3/1/2022.
Source: Bloomberg, Amherst Pierpont Securities
The increase in issuance has led to a deeper and more liquid secondary trading market (Exhibit 2). Secondary trading in the SFR market averaged between $300 million and $400 million a month before the pandemic, then surged to $710 million a month in 2020 and $544 million a month in 2021. As the market has become more volatile in 2022 liquidity has deepened, with monthly average trading volumes above $750 million for the first two months of 2022.
The mix of secondary market trading is also indicative of robust liquidity across the capital structure. The AAA-rated A tranches of deals, which are typically the largest sized tranche in a deal, account for about 40% of SFR trading volume. The E tranches of deals, which are generally the lowest investment grade rated classes at BBB+ to BBB-, account for about 17% of trading volume. The high yield and unrated classes (F and above) which are often privately placed and attractive to hedge funds, account for 19% of secondary market trading volume. The number of trades a month has also risen from averaging 150 a month pre-pandemic to 200 to 300 a month.
Exhibit 2: Secondary trading volumes (by SFR tranche)
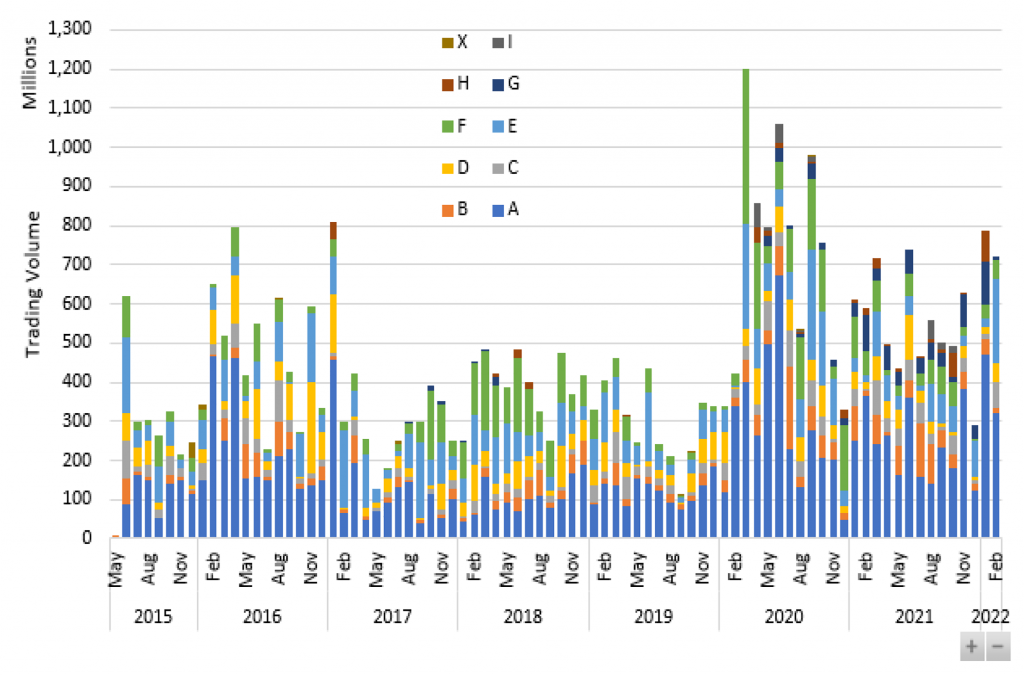
Note: Trading volumes have been consolidated across tranches with the same letter, e.g. all trading of F, F1 and F2 tranches is summarized under the “F” tranche. Data through 2/24/2022.
Source: FINRA Trace, Amherst Pierpont Securities
The number of trades a month has also risen from averaging 150 a month pre-pandemic to 200 to 300 a month (Exhibit 3).
Exhibit 3: Secondary trading volume in SFR
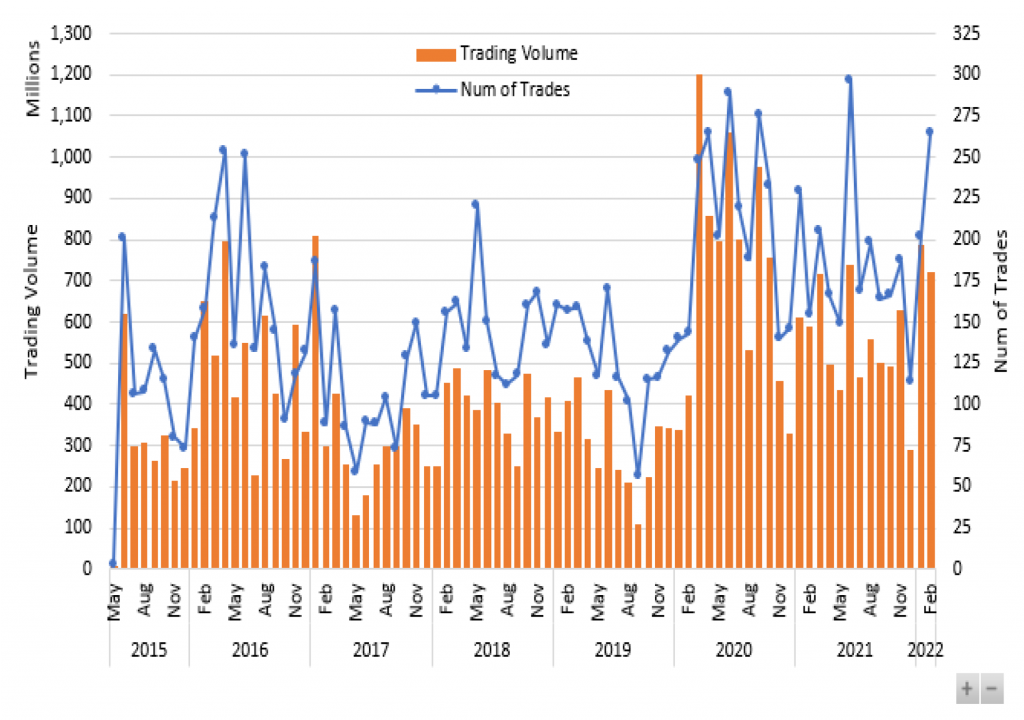
Note: Data through 2/24/2022.
Source: FINRA Trace, Amherst Pierpont Securities
Market volatility has driven spreads wider in recent months across most products. SFR spreads in the secondary market have varied significantly by rating and tranche. Bid-ask spreads for the ‘AAA’ A classes have widened modestly in 2022, but so far they remain mostly below 100 bp (Exhibit 4). The D tranches, which are mostly ‘BBB’, have widened in secondary trading from the low 100s during the recent tights of mid-2021, to the high 100s touching 200 bp in a few trades this year. There’s considerable spread range depending on the deal and rating (BBB+ / BBB / BBB-), but the widening so far in 2022 has taken Ds back to where they were in early 2021 and late 2016.
Exhibit 4: SFR secondary market trading spreads to for select classes
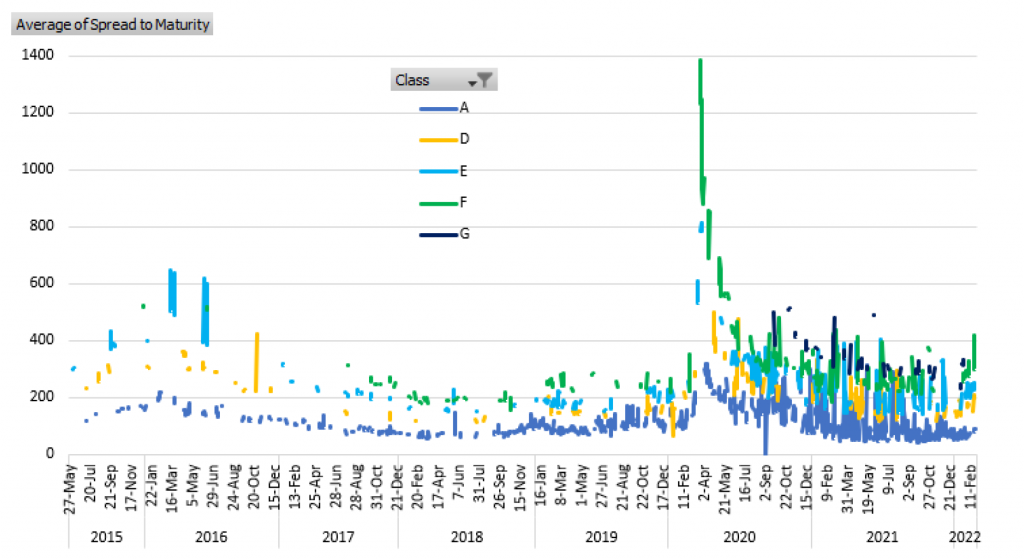
Note: Spreads shown are spreads to swaps to final maturity, without extension. Both bid and ask spreads are included. Transactions in the same Cusip typically occur on the same day. When multiple Cusips of the same class trade on the same day, average spreads are shown which can result in very wide apparent bid-ask spreads, though they often include multiple Cusips, particularly on heavy trading and issuance days. Data through 2/24/2022.
Source: FINRA Trace, Amherst Pierpont Securities
The F classes are typically non-investment grade, and those spreads have widened to 300 to 400 bp in some recent trades, while the unrated Gs have been trading in the 300 to 500 bp spread range. The more subordinated, unrated classes trade less frequently are highly deal dependent, but some have printed in the 600 bp to 1000 bp spread range over the last few months.
This material is intended only for institutional investors and does not carry all of the independence and disclosure standards of retail debt research reports. In the preparation of this material, the author may have consulted or otherwise discussed the matters referenced herein with one or more of SCM’s trading desks, any of which may have accumulated or otherwise taken a position, long or short, in any of the financial instruments discussed in or related to this material. Further, SCM may act as a market maker or principal dealer and may have proprietary interests that differ or conflict with the recipient hereof, in connection with any financial instrument discussed in or related to this material.
This message, including any attachments or links contained herein, is subject to important disclaimers, conditions, and disclosures regarding Electronic Communications, which you can find at https://portfolio-strategy.apsec.com/sancap-disclaimers-and-disclosures.
Important Disclaimers
Copyright © 2026 Santander US Capital Markets LLC and its affiliates (“SCM”). All rights reserved. SCM is a member of FINRA and SIPC. This material is intended for limited distribution to institutions only and is not publicly available. Any unauthorized use or disclosure is prohibited.
In making this material available, SCM (i) is not providing any advice to the recipient, including, without limitation, any advice as to investment, legal, accounting, tax and financial matters, (ii) is not acting as an advisor or fiduciary in respect of the recipient, (iii) is not making any predictions or projections and (iv) intends that any recipient to which SCM has provided this material is an “institutional investor” (as defined under applicable law and regulation, including FINRA Rule 4512 and that this material will not be disseminated, in whole or part, to any third party by the recipient.
The author of this material is an economist, desk strategist or trader. In the preparation of this material, the author may have consulted or otherwise discussed the matters referenced herein with one or more of SCM’s trading desks, any of which may have accumulated or otherwise taken a position, long or short, in any of the financial instruments discussed in or related to this material. Further, SCM or any of its affiliates may act as a market maker or principal dealer and may have proprietary interests that differ or conflict with the recipient hereof, in connection with any financial instrument discussed in or related to this material.
This material (i) has been prepared for information purposes only and does not constitute a solicitation or an offer to buy or sell any securities, related investments or other financial instruments, (ii) is neither research, a “research report” as commonly understood under the securities laws and regulations promulgated thereunder nor the product of a research department, (iii) or parts thereof may have been obtained from various sources, the reliability of which has not been verified and cannot be guaranteed by SCM, (iv) should not be reproduced or disclosed to any other person, without SCM’s prior consent and (v) is not intended for distribution in any jurisdiction in which its distribution would be prohibited.
In connection with this material, SCM (i) makes no representation or warranties as to the appropriateness or reliance for use in any transaction or as to the permissibility or legality of any financial instrument in any jurisdiction, (ii) believes the information in this material to be reliable, has not independently verified such information and makes no representation, express or implied, with regard to the accuracy or completeness of such information, (iii) accepts no responsibility or liability as to any reliance placed, or investment decision made, on the basis of such information by the recipient and (iv) does not undertake, and disclaims any duty to undertake, to update or to revise the information contained in this material.
Unless otherwise stated, the views, opinions, forecasts, valuations, or estimates contained in this material are those solely of the author, as of the date of publication of this material, and are subject to change without notice. The recipient of this material should make an independent evaluation of this information and make such other investigations as the recipient considers necessary (including obtaining independent financial advice), before transacting in any financial market or instrument discussed in or related to this material.
Important disclaimers for clients in the EU and UK
This publication has been prepared by Trading Desk Strategists within the Sales and Trading functions of Santander US Capital Markets LLC (“SanCap”), the US registered broker-dealer of Santander Corporate & Investment Banking. This communication is distributed in the EEA by Banco Santander S.A., a credit institution registered in Spain and authorised and regulated by the Bank of Spain and the CNMV. Any EEA recipient of this communication that would like to affect any transaction in any security or issuer discussed herein should do so with Banco Santander S.A. or any of its affiliates (together “Santander”). This communication has been distributed in the UK by Banco Santander, S.A.’s London branch, authorised by the Bank of Spain and subject to regulatory oversight on certain matters by the Financial Conduct Authority (FCA) and the Prudential Regulation Authority (PRA).
The publication is intended for exclusive use for Professional Clients and Eligible Counterparties as defined by MiFID II and is not intended for use by retail customers or for any persons or entities in any jurisdictions or country where such distribution or use would be contrary to local law or regulation.
This material is not a product of Santander´s Research Team and does not constitute independent investment research. This is a marketing communication and may contain ¨investment recommendations¨ as defined by the Market Abuse Regulation 596/2014 ("MAR"). This publication has not been prepared in accordance with legal requirements designed to promote the independence of research and is not subject to any prohibition on dealing ahead of the dissemination of investment research. The author, date and time of the production of this publication are as indicated herein.
This publication does not constitute investment advice and may not be relied upon to form an investment decision, nor should it be construed as any offer to sell or issue or invitation to purchase, acquire or subscribe for any instruments referred herein. The publication has been prepared in good faith and based on information Santander considers reliable as of the date of publication, but Santander does not guarantee or represent, express or implied, that such information is accurate or complete. All estimates, forecasts and opinions are current as at the date of this publication and are subject to change without notice. Unless otherwise indicated, Santander does not intend to update this publication. The views and commentary in this publication may not be objective or independent of the interests of the Trading and Sales functions of Santander, who may be active participants in the markets, investments or strategies referred to herein and/or may receive compensation from investment banking and non-investment banking services from entities mentioned herein. Santander may trade as principal, make a market or hold positions in instruments (or related derivatives) and/or hold financial interest in entities discussed herein. Santander may provide market commentary or trading strategies to other clients or engage in transactions which may differ from views expressed herein. Santander may have acted upon the contents of this publication prior to you having received it.
This publication is intended for the exclusive use of the recipient and must not be reproduced, redistributed or transmitted, in whole or in part, without Santander’s consent. The recipient agrees to keep confidential at all times information contained herein.


