By the Numbers
Finding MBS with faster prepayment speeds below par
This material is a Marketing Communication and does not constitute Independent Investment Research.
Higher mortgage rates this year have understandably spun up a lot of new interest in MBS with extension protection. More than 60% of conventional 30-year MBS now trade below par, a sharp increase from 4% at the start of the year. Investors need to find collateral that prepays faster when borrowers cannot refinance into a lower mortgage rate. The most interesting candidates include loans from specific states, loans with lower balances and loans with lower FICO scores. Faster speeds could add as much as 16/32s of value, and that could go higher if rates continue to rise. And combining attributes may boost pay-ups further.
Typically, there is limited information on prepayment speeds in MBS trading below par since mortgage rates have generally trended lower for the last 40 years. But refinance activity in 2020 and 2021 created a modest cohort of 30-year 1.5% pools that have generally traded at or below par since origination. The 1.5% pools provide some insights. In studying various collateral attributes, it is important to control for the impact of other attributes. For example, estimating the effect of state on prepayment speeds should control for loan size, FICO, servicer, and other attributes. Otherwise, the impact attributed to state might only reflect the influence of loan size. The effect of loan size needs to control for state and all other attributes, and so on.
The impact of geography
State has a large influence on discount prepayment speeds. Loans from Arizona, all else equal, prepaid roughly 25% faster over the last two years, for example (Exhibit 1). On the other side, discount loans from New York prepaid more than 30% slower. Housing turnover is a primary contributor, as many of the states with faster prepayment speeds have hotter housing markets and net inflows of residents. Cashout refinances likely also play a role, especially in states with high home price appreciation. Appreciation can drive housing turnover, but states with tight housing supply may not reap the full benefit. But cashout refinance activity is not constrained by supply and have a tighter correlation with HPA.
Exhibit 1. Discount prepayment speeds vary across states
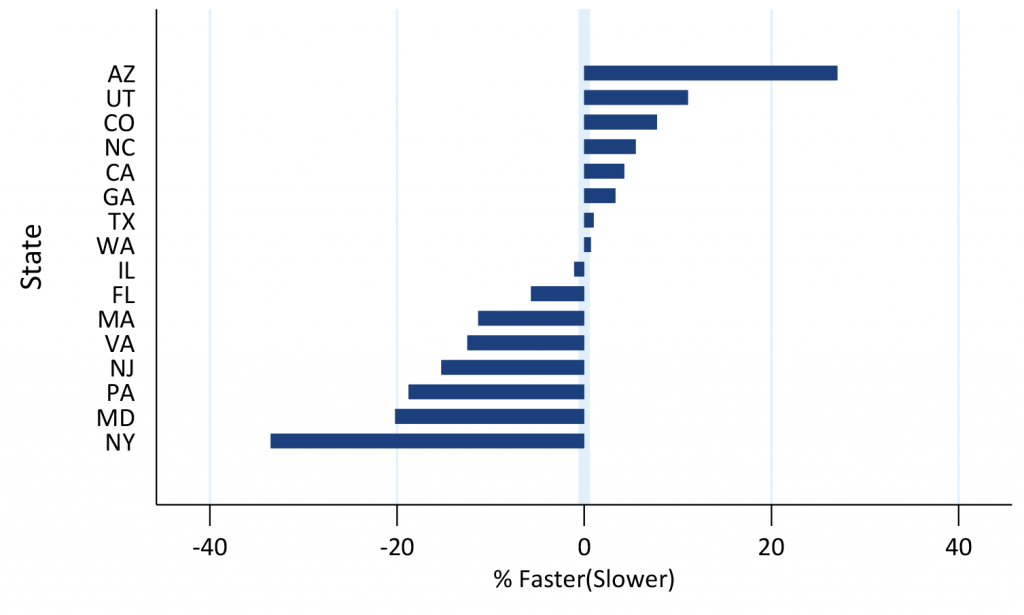
Source: Fannie Mae, Freddie Mac, Amherst Pierpont Securities
Loans from Arizona, prepaying roughly 25% faster than the average loan, should be worth 16/32s more in a FNCL 1.5% pool (Exhibit 2). This is determined by calculating the FNCL 1.5% TBA OAS using Yield Book’s prepayment model, then dialing the model with 25% faster discount prepayment speeds and calculating a price using the TBA’s OAS. The dialed pool is projected to prepay 6.7 CPR for life, compared to 5.6 CPR for the TBA. That is a small absolute CPR difference and would not be very meaningful in a fast prepay refinance environment. But small speeds difference matter in a turnover environment and especially in a security now trading below $93-00.
Exhibit 2. A 25% boost to turnover speeds adds 16/32s to a FNCL 1.5% pool

Source: Yield Book, Amherst Pierpont Securities
The theoretical pay-up depends on the coupon and amount of prepayment difference (Exhibit 3). The pay-up is bigger for pools that trade farther below par, while faster turnover has negligible effect on FNCL 3.0%s that are currently trading slightly above par.
Exhibit 3. Price sensitivity varies with coupon
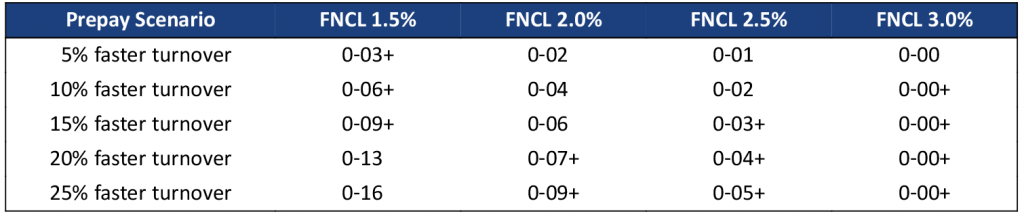
Source: Yield Book, Amherst Pierpont Securities
The impact of credit score
Borrowers with lower credit scores also tend to prepay faster in a discount environment. These borrowers may be new borrowers that can benefit from credit curing to move into a larger home. They also may be more likely to access home equity using a cashout refinance. And default rates may also be higher and contribute to faster discount speeds. Borrowers with a FICO score of 700 or lower prepay from roughly 7% to nearly 15% faster than borrowers with higher scores (Exhibit 4). As indicated earlier, a 5% faster speed in a 30-year 1.5% pool currently is worth an estimated 3.5/32s more than TBA, a 10% speed is worth 6.5/32s and a 15% speed is worth 9.5/32s (Exhibit 3).
Exhibit 4. Low FICO loans prepaid faster out of the money
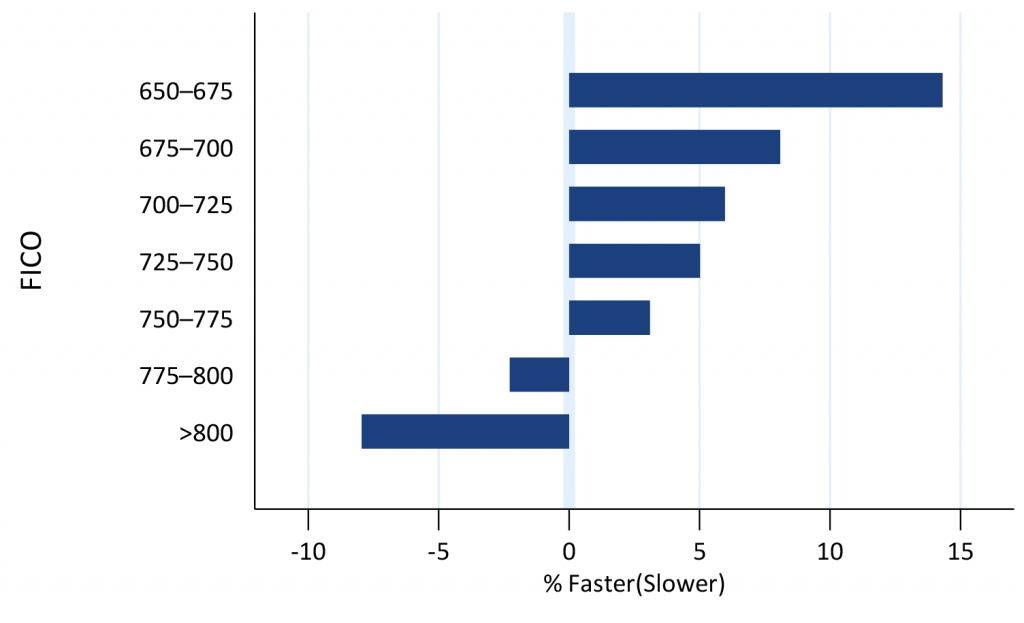
Source: Fannie Mae, Freddie Mac, Amherst Pierpont Securities
The impact of loan size
Smaller loans also tend to prepay faster in a discount environment, while larger loans prepay slower. Loans of $85,000 or below prepay roughly 10% to 15% faster than average while loans of $500,000 or above prepay between 7% go more than 10% faster. These borrowers with smaller loans often are in starter homes and will eventually need to buy a bigger house, driving faster prepayment speeds.
Exhibit 5. Low balance loans have faster discount prepayment speeds
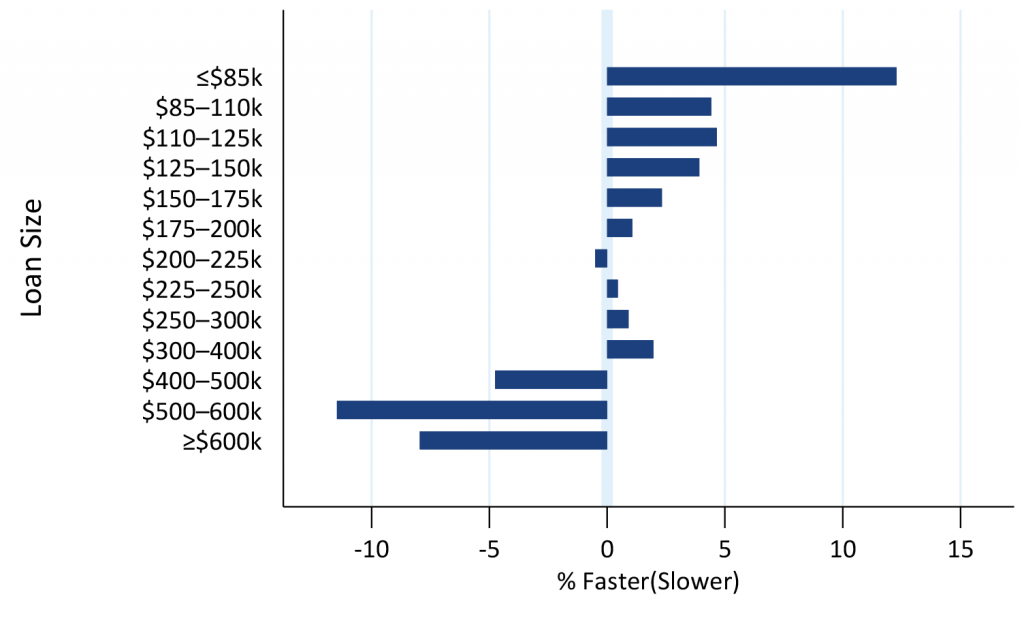
Source: Fannie Mae, Freddie Mac, Amherst Pierpont Securities
The impact of LTV
Discount prepayment speeds tend to be faster for loans that have current LTV’s below 80% but still are paying mortgage insurance (Exhibit 6). The borrower has additional incentive to refinance to stop paying insurance premiums. Although Fannie Mae and Freddie Mac allow cancelling mortgage insurance in some instances, lenders are not allowed to solicit borrowers. It is possible that borrowers refinance because they are unaware they might be able to cancel their mortgage insurance.
Exhibit 6. Loans with MI prepay to cancel mortgage insurance
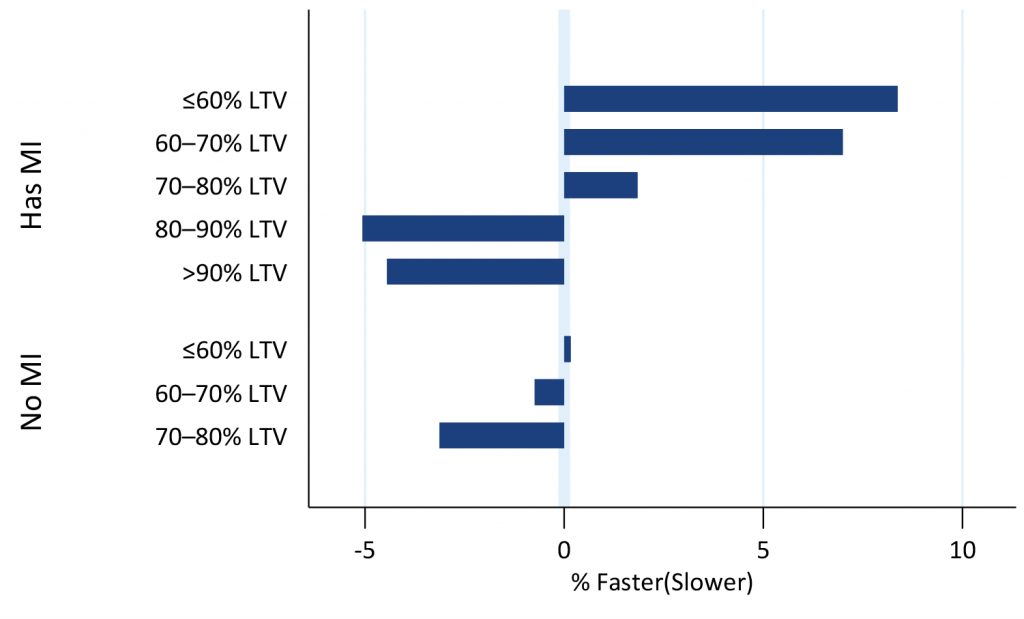
Source: Fannie Mae, Freddie Mac, Amherst Pierpont Securities
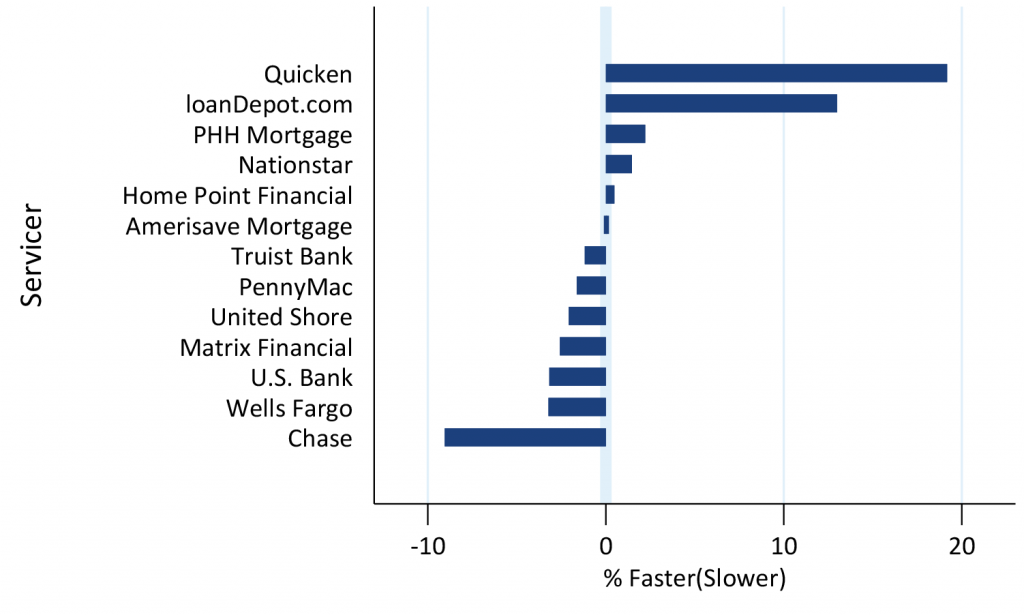
The impact of servicer
Some servicers have a large effect on refinance speeds, and this might carry over to discount prepayment speeds (Exhibit 7). This shows the residual effect of some of the largest conventional servicers on discount speeds over the last two years. Quicken and loanDepot tend to prepay much faster than other servicers, while Chase is lagging with much slower speeds. However, it is still uncertain whether the faster servicers will be able to maintain that behavior.
Exhibit 7. Servicer may have a large influence on discount speeds
Source: Fannie Mae, Freddie Mac, Amherst Pierpont Securities
The impact of loan purpose
Rate/term refinances prepay slightly faster when out-of-the-money (Exhibit 8). Refinance loans have additional seasoning that isn’t reflected in the loan age when compared to purchase loans. Purchase loans and cashout refinances tend to prepay a little slower. The cashout result is surprising since these loans also have additional seasoning that isn’t reflected in the loan age. It’s possible that the limited amount of data is insufficient to properly identify this effect.
Exhibit 8. Rate/term refis tend to have faster discount speeds than other loan purposes
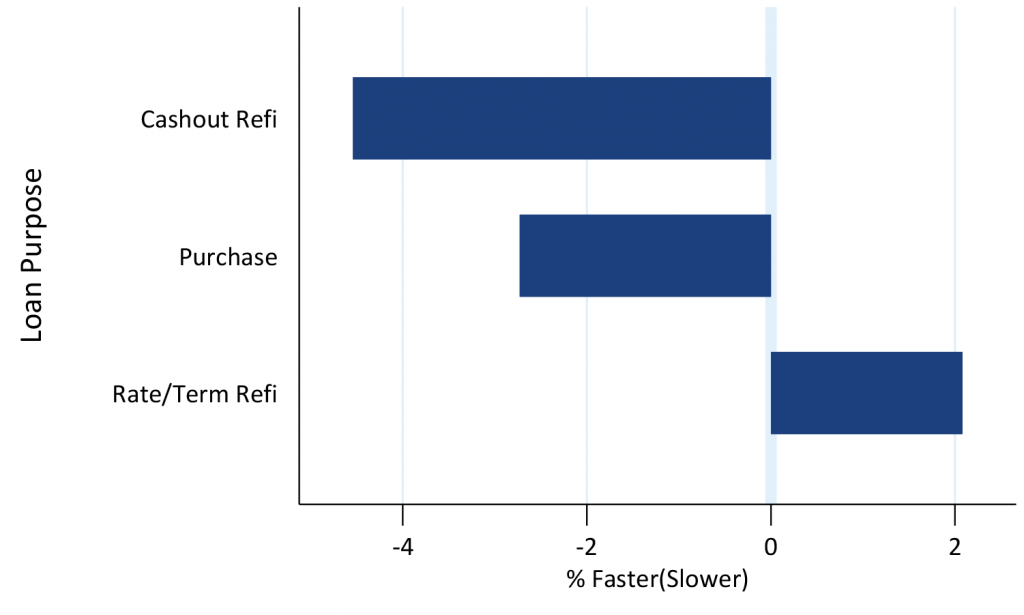
Source: Fannie Mae, Freddie Mac, Amherst Pierpont Securities
The opportunities
The MBS market is just starting to figure out the nuances of prepayments in pools trading below par where borrowers have no rate incentives to refinance. Those pools also happen to be ones where, except for loan balance and some geographies, price premiums to par are low or nonexistant. Of course, it may be difficult to find pure plays on attributes such as geography in pools trading in secondary at a discount. The best opportunities are likely to be in LTV or FICO pools, where investors can find pure plays and where price premiums to TBA are small.
This material is intended only for institutional investors and does not carry all of the independence and disclosure standards of retail debt research reports. In the preparation of this material, the author may have consulted or otherwise discussed the matters referenced herein with one or more of SCM’s trading desks, any of which may have accumulated or otherwise taken a position, long or short, in any of the financial instruments discussed in or related to this material. Further, SCM may act as a market maker or principal dealer and may have proprietary interests that differ or conflict with the recipient hereof, in connection with any financial instrument discussed in or related to this material.
This message, including any attachments or links contained herein, is subject to important disclaimers, conditions, and disclosures regarding Electronic Communications, which you can find at https://portfolio-strategy.apsec.com/sancap-disclaimers-and-disclosures.
Important Disclaimers
Copyright © 2026 Santander US Capital Markets LLC and its affiliates (“SCM”). All rights reserved. SCM is a member of FINRA and SIPC. This material is intended for limited distribution to institutions only and is not publicly available. Any unauthorized use or disclosure is prohibited.
In making this material available, SCM (i) is not providing any advice to the recipient, including, without limitation, any advice as to investment, legal, accounting, tax and financial matters, (ii) is not acting as an advisor or fiduciary in respect of the recipient, (iii) is not making any predictions or projections and (iv) intends that any recipient to which SCM has provided this material is an “institutional investor” (as defined under applicable law and regulation, including FINRA Rule 4512 and that this material will not be disseminated, in whole or part, to any third party by the recipient.
The author of this material is an economist, desk strategist or trader. In the preparation of this material, the author may have consulted or otherwise discussed the matters referenced herein with one or more of SCM’s trading desks, any of which may have accumulated or otherwise taken a position, long or short, in any of the financial instruments discussed in or related to this material. Further, SCM or any of its affiliates may act as a market maker or principal dealer and may have proprietary interests that differ or conflict with the recipient hereof, in connection with any financial instrument discussed in or related to this material.
This material (i) has been prepared for information purposes only and does not constitute a solicitation or an offer to buy or sell any securities, related investments or other financial instruments, (ii) is neither research, a “research report” as commonly understood under the securities laws and regulations promulgated thereunder nor the product of a research department, (iii) or parts thereof may have been obtained from various sources, the reliability of which has not been verified and cannot be guaranteed by SCM, (iv) should not be reproduced or disclosed to any other person, without SCM’s prior consent and (v) is not intended for distribution in any jurisdiction in which its distribution would be prohibited.
In connection with this material, SCM (i) makes no representation or warranties as to the appropriateness or reliance for use in any transaction or as to the permissibility or legality of any financial instrument in any jurisdiction, (ii) believes the information in this material to be reliable, has not independently verified such information and makes no representation, express or implied, with regard to the accuracy or completeness of such information, (iii) accepts no responsibility or liability as to any reliance placed, or investment decision made, on the basis of such information by the recipient and (iv) does not undertake, and disclaims any duty to undertake, to update or to revise the information contained in this material.
Unless otherwise stated, the views, opinions, forecasts, valuations, or estimates contained in this material are those solely of the author, as of the date of publication of this material, and are subject to change without notice. The recipient of this material should make an independent evaluation of this information and make such other investigations as the recipient considers necessary (including obtaining independent financial advice), before transacting in any financial market or instrument discussed in or related to this material.
Important disclaimers for clients in the EU and UK
This publication has been prepared by Trading Desk Strategists within the Sales and Trading functions of Santander US Capital Markets LLC (“SanCap”), the US registered broker-dealer of Santander Corporate & Investment Banking. This communication is distributed in the EEA by Banco Santander S.A., a credit institution registered in Spain and authorised and regulated by the Bank of Spain and the CNMV. Any EEA recipient of this communication that would like to affect any transaction in any security or issuer discussed herein should do so with Banco Santander S.A. or any of its affiliates (together “Santander”). This communication has been distributed in the UK by Banco Santander, S.A.’s London branch, authorised by the Bank of Spain and subject to regulatory oversight on certain matters by the Financial Conduct Authority (FCA) and the Prudential Regulation Authority (PRA).
The publication is intended for exclusive use for Professional Clients and Eligible Counterparties as defined by MiFID II and is not intended for use by retail customers or for any persons or entities in any jurisdictions or country where such distribution or use would be contrary to local law or regulation.
This material is not a product of Santander´s Research Team and does not constitute independent investment research. This is a marketing communication and may contain ¨investment recommendations¨ as defined by the Market Abuse Regulation 596/2014 ("MAR"). This publication has not been prepared in accordance with legal requirements designed to promote the independence of research and is not subject to any prohibition on dealing ahead of the dissemination of investment research. The author, date and time of the production of this publication are as indicated herein.
This publication does not constitute investment advice and may not be relied upon to form an investment decision, nor should it be construed as any offer to sell or issue or invitation to purchase, acquire or subscribe for any instruments referred herein. The publication has been prepared in good faith and based on information Santander considers reliable as of the date of publication, but Santander does not guarantee or represent, express or implied, that such information is accurate or complete. All estimates, forecasts and opinions are current as at the date of this publication and are subject to change without notice. Unless otherwise indicated, Santander does not intend to update this publication. The views and commentary in this publication may not be objective or independent of the interests of the Trading and Sales functions of Santander, who may be active participants in the markets, investments or strategies referred to herein and/or may receive compensation from investment banking and non-investment banking services from entities mentioned herein. Santander may trade as principal, make a market or hold positions in instruments (or related derivatives) and/or hold financial interest in entities discussed herein. Santander may provide market commentary or trading strategies to other clients or engage in transactions which may differ from views expressed herein. Santander may have acted upon the contents of this publication prior to you having received it.
This publication is intended for the exclusive use of the recipient and must not be reproduced, redistributed or transmitted, in whole or in part, without Santander’s consent. The recipient agrees to keep confidential at all times information contained herein.


