


The Big Idea
Russia-Ukraine and market disruption
Steven Abrahams | February 25, 2022
This material is a Marketing Communication and does not constitute Independent Investment Research.
The Russia-Ukraine conflict has already disrupted markets and will almost certainly have impact for longer than just the current active phase. The size of the conflicting economies suggest Russia is at clear economic disadvantage against countries that have started to impose sanctions, and key trade flows suggest any economic leverage will come mainly from energy and agricultural exports. Although active conflict has grabbed the headlines, the more important contest will play out through sanctions over time. And there, Russia’s recent agreement with China could provide important support.
Through the lens of GDP
Russia is now in economic conflict with a much larger set of forces than Ukraine. Russia had the world’s fifth largest economy in 2020, according to the OECD, with GDP of $4.4 trillion (Exhibit 1). But the economies of countries now starting to impose sanctions generated GDP that year of nearly $48 trillion. US GDP came in at nearly $21 trillion, EU at $20 trillion, Japan at $5.3 trillion and Australia at $1.4 trillion. If Russia has to devote significant resources to Ukraine or has to match higher defense spending from countries now imposing sanctions, the cost of ongoing conflict could become a much larger share of Russia’s GDP and take resources away from other domestic needs.
Exhibit 1: GDP of selected countries
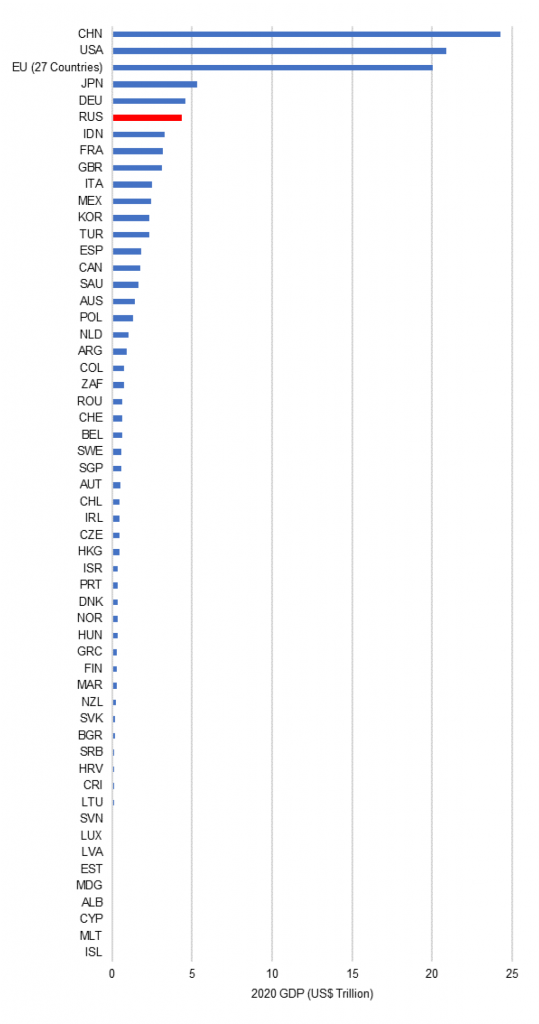
Note: Data shows 2020 GDP in USD trillion.
Source: OECD, Amherst Pierpont Securities
Russia’s recent agreement with China could provide important economic support. China reported a 2020 GDP of $24.3 trillion, a sizable counterweight to countries sanctioning Russia. China and other countries could become buyers of Russia’s exports, or could become intermediaries, buying Russia’s exports and reselling to other countries. It will be harder for China or other countries to entirely replace some of Russia’s imports, such as semiconductors, automobiles or some types of advanced machinery. Sanctions that restrict Russia’s use of global banking systems could lead non-sanctioning countries to hesitate trading through normal channels and may push more trade into bartering arrangements, with much higher frictions.
Russia’s trade flows are equivalent to nearly 50% of its entire GDP, according to the World Bank, so trade critical to running the economy. More than 90% of Russia’s exports are in oil, natural gas, coal and other raw materials such as wheat and grains. China or other countries that choose not to impose sanctions could become important buyers of Russia’s goods and services. The recent spike in oil and commodity prices also reduces Russia’s needs to export in order to generate the same net revenue.
It is notable that the initial round of sanctions allows Russia to continue trading in energy and agricultural commodities. Russia will still be able to sell its most valuable exports and generate foreign exchange. Restrictions on imports are more binding.
Through the lens of Russia’s exports
Russia’s export ties point to the countries where disruption of Russia’s trade flows could hit first. The impact depends both on the trade partner as a share of Russia’s exports and those exports as a share of the partner’s imports. China is the largest buyer of Russia’s exports, for example, absorbing 13.43% of Russia’s total (Exhibit 2). But Russia is a much smaller part of China’s total imports, providing 2.2% of China’s total. The Netherlands, Germany, Belarus and Turkey round out Russia’s Top 5 trading partners. For the Netherlands, Russia provides 9.2% of total imports, for Germany 2.1%, for Turkey 12.8%. The vast majority of these exports are likely energy and grain. With the Netherlands, Germany and Turkey inside of NATO—and with Russia providing a meaningful share of total imports for Poland, Finland and Latvia, too, among others—the incentives to allow ongoing trade in these products are clear for now.
Exhibit 2: Countries most vulnerable to disruption of exports from the Russian Federation
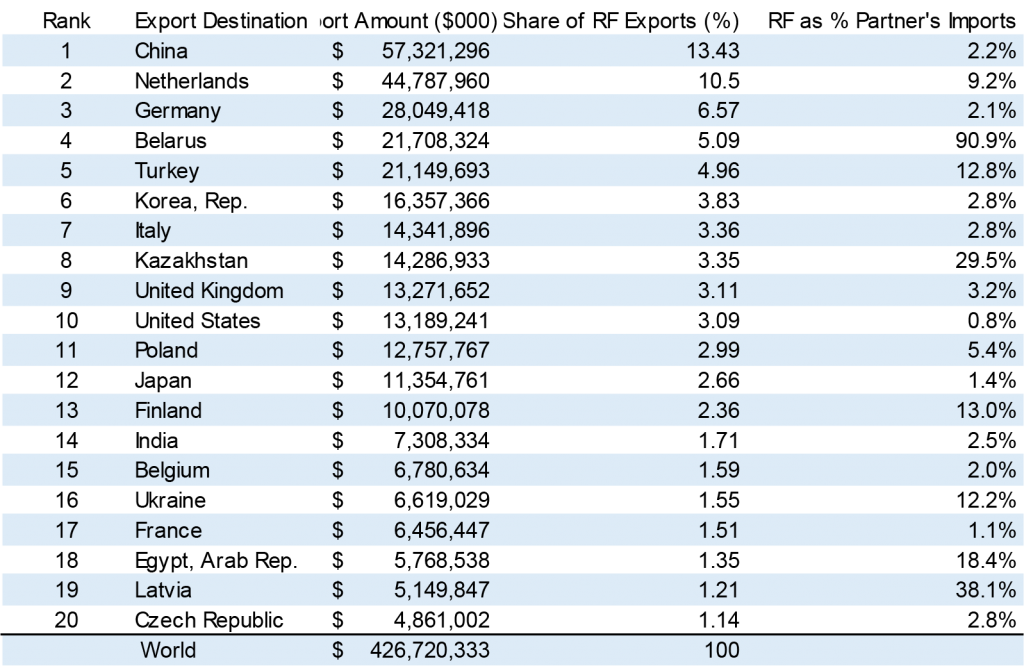
Note: All figures show exports in USD from the Russian Federation as of 2019.
Source: World Bank, World Integrated Trade Solution, Amherst Pierpont Securities.
Russia’s exports also point to the market’s most likely to be affected. Oil, natural gas and coal make up 51.95% of Russia’s exports, with wheat other raw materials coming in at 38.64% (Exhibit 3). This explains the recent sensitivity of energy and commodity markets to the Russia-Ukraine conflict. It also highlights the importance of provisions in the first round of sanctions that allow further trade in these products.
Exhibit 3: Products most vulnerable to disruption of exports from the Russian Federation
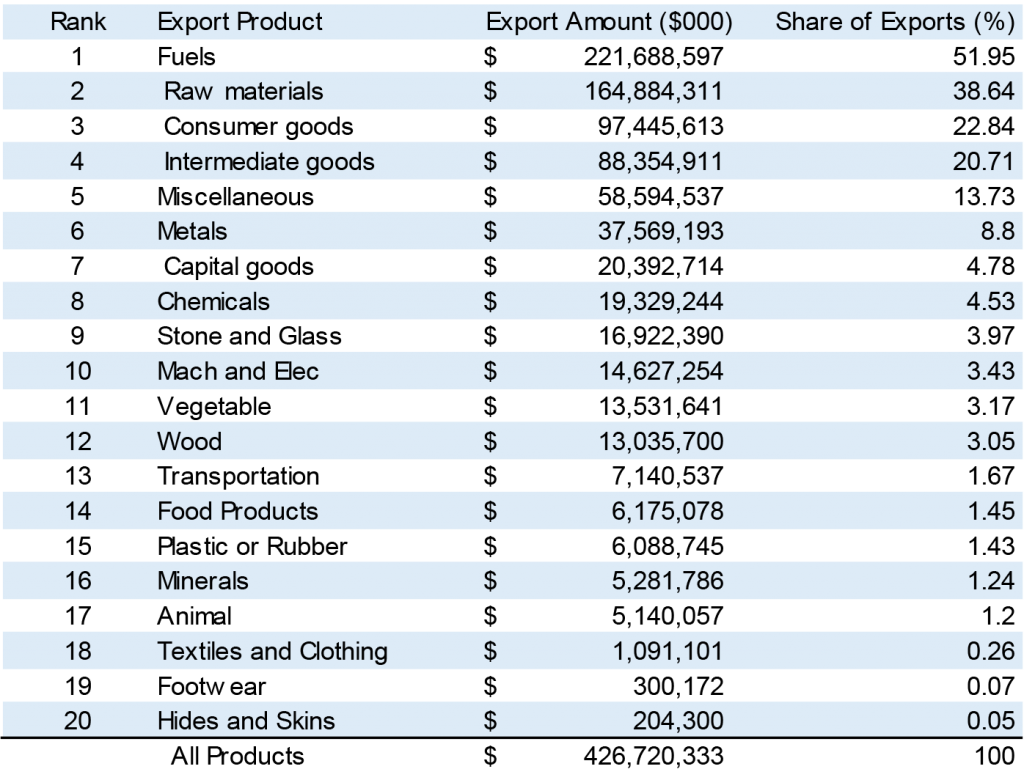
Note: All figures show exports in USD from the Russian Federation as of 2019.
Source: World Bank, World Integrated Trade Solution, Amherst Pierpont Securities.
Given the importance of oil and natural gas to Russia, the ultimate impact of conflict on that market will depend on the response from other producers. Russia was the third largest producer in 2020, according to the US Energy Information Administration, at 10.5 million barrels a day or 11% of the world total (Exhibit 4). Of the other Top 5 producers, the United States and Saudi Arabia produced more and Canada and China produced less. If countries now imposing sanctions chose to cut off payments for energy, other producers would have to make up the difference.
Exhibit 4: Russia was the world’s third largest oil and gas producer in 2020
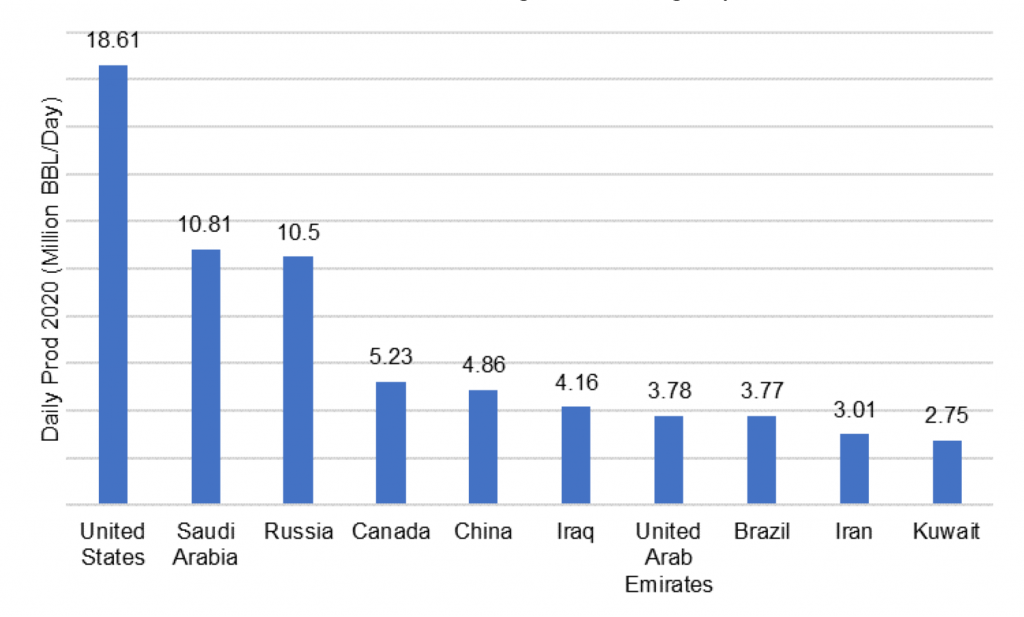
Source: US Energy Information Administration, Amherst Pierpont Securities
Through the lens of Russia’s imports
Russia is also a customer of many exporting countries, although it imports only 58% as much as it exports. China is the leading seller to Russia, providing 21.91% of Russia’s total imports although Russia takes only 3.3% of China’s total (Exhibit 5). Germany provides 10.16% of Russia’s imports although Russia takes only 2.2% of Germany’s total. Belarus, the United States and Italy round out the Top 5 sellers. Only Belarus relies heavily on Russia as a customer, with Russia taking 41.4% of Belarus’ total exports.
Exhibit 5: Countries most vulnerable to loss of imports to the Russian Federation
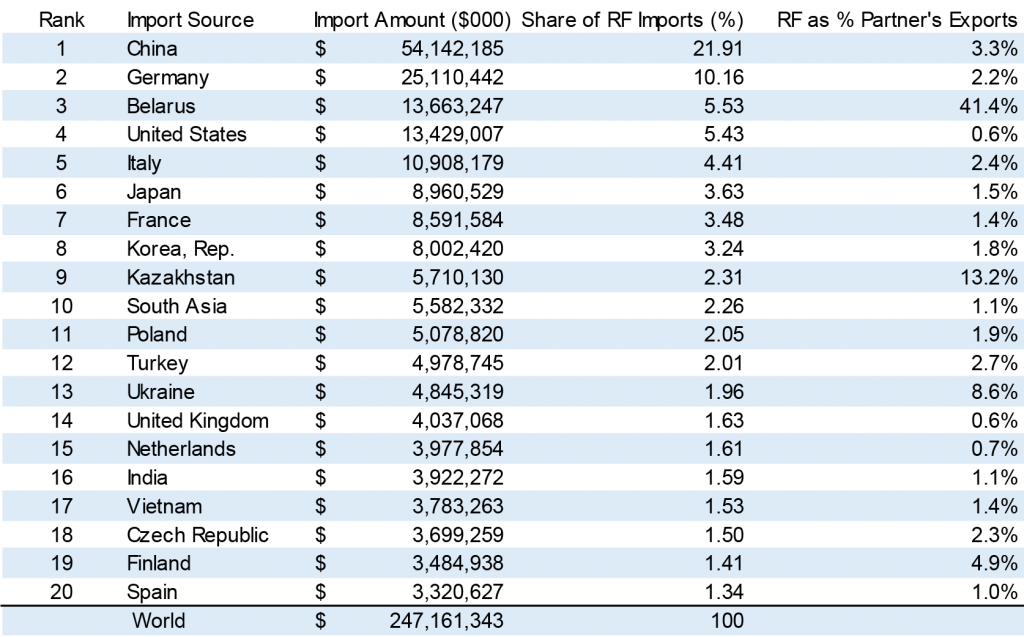
Note: All figures show exports in USD from the Russian Federation as of 2019.
Source: World Bank, World Integrated Trade Solution.
The nature of Russia imports is more important than the source. Russia’s main imports include capital goods, consumer goods, machinery and electronics, intermediate goods and chemicals (Exhibit 6). Those broad categories include telecommunications equipment, for example, pharmaceuticals, aircraft, automobiles and machine parts. It seems likely that non-sanctioning countries would have trouble replacing those goods unless the non-sanctioning country served as an intermediary. Sanctions that tracked payments through global banking systems would make intermediation difficult, and barter would not substitute. Sanctions that cut off imports of finished goods and replacement parts make maintaining or growing existing infrastructure difficult.
Exhibit 6: Products most vulnerable to loss of imports to the Russian Federation
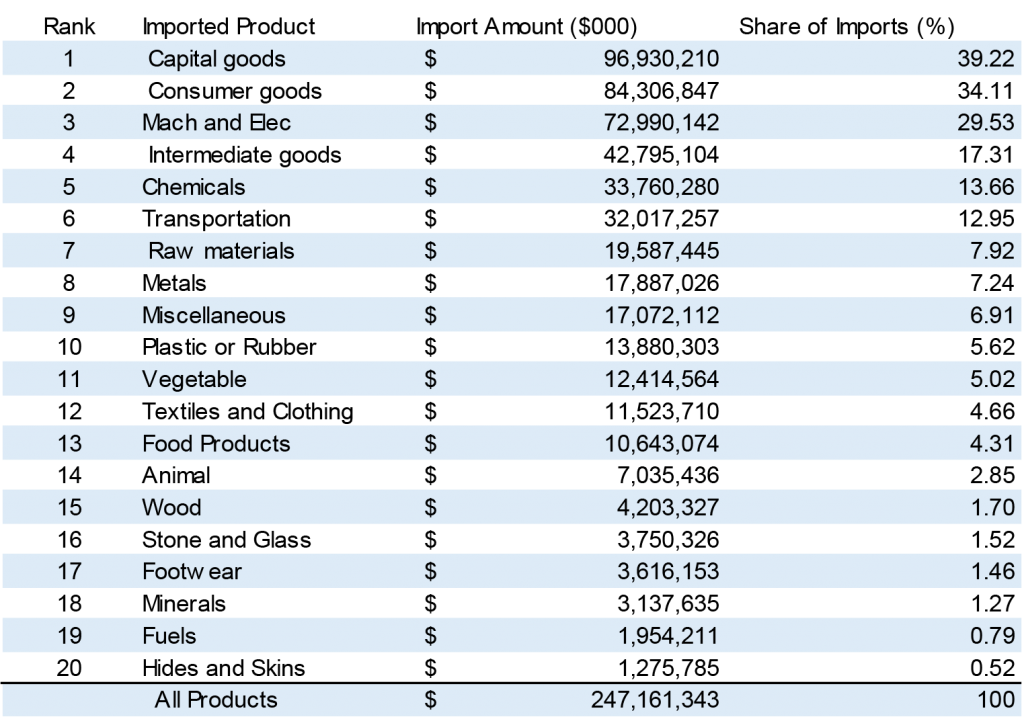
Note: All figures show exports in USD from the Russian Federation as of 2019.
Source: World Bank, World Integrated Trade Solution, Amherst Pierpont Securities.
Through the lens of cross-border banking
Global exposure to Russia through lending looks limited. Russia reported $88.9 billion in loans to the rest of the world as of the third quarter of 2021, according to the Bank for International Settlements, and $127.7 billion in loans from the rest of the world. To put that in context, total global cross-border loans to other countries tallied $35.4 trillion and loans from other countries tallied $32.1 trillion.
Other considerations
Russia’s military capacity has potential to create far more volatility than its economy, and the prospect of refugees from Ukraine’s 44 million people could affect surrounding economies.
After the current active phase of conflict, a likely longer second phase starts where sanctions play the main role. The competition leaves plenty of room for change. The countries imposing sanctions could choose to cut Russia off from payments for energy and agricultural commodities, blocking most of Russia’s exports and its sources of foreign exchange. Of course, China could take an active role in absorbing more of Russia’s exports.
Finally, Russia has a long history of absorbing sanctions—including those imposed after its 2014 annexation of Crimea—and has capacity to absorb sanctions again. It has reduced external debt from more than $700 billion in 2014 to less than $500 billion in 2021, according to analysis by CreditSights. It has run current account surpluses, allowing it to build foreign exchange and gold reserves from $350 billion in early 2015 to $643 billion today. Limited debt and ample reserves could take Russia a long way before the effects of sanctions became visible.