


The Big Idea
MBS looks for its next relationship
Steven Abrahams | February 25, 2022
This material is a Marketing Communication and does not constitute Independent Investment Research.
Just as the Fed prepares to end QE and as MBS looks for another suitor, banks and bond funds have also started dealing with other overriding issues. Bank balance sheets are shrinking, and bond funds have started losing assets. The changing flows could add to the challenges of managing MBS through a bearish market. Other investor sectors increasingly seem like the place to look for the next marginal buyer.
The Fed
The Fed holds an $8.4 trillion portfolio and has made its plans pretty clear. It will stop adding Treasury debt and MBS in March, will reinvest principal for a while to keep its portfolio balance steady and then will let its balances run off. The timing is still up in the air, but run off is likely to start late this year. Fed Treasury balances probably will decline by $30 billion a month initially and quickly rise to $50 billion a month. MBS balances probably will decline by $30 billion a month and rise from there. The January FOMC minutes also mention the possibility of eventually selling MBS. At $80 billion a month or $960 billion a year, the portfolio would decline by 11.7% annually. Barring any need to ease, the runoff should last for years.
Exhibit 1: The Fed will likely start portfolio run-off later this year
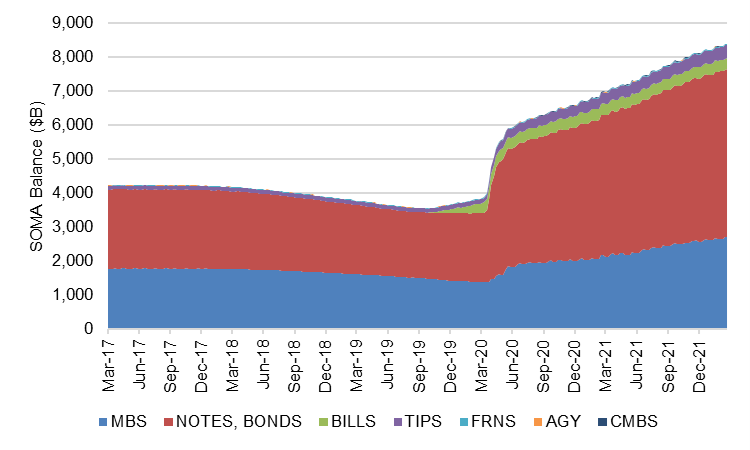
Note: Data through 23 Feb 2022. Source: Bloomberg, Amherst Pierpont Securities
The Fed’s plans and its willingness to consider MBS sales has contributed to wider spreads in MBS than in other benchmarks (Exhibit 2). Since the beginning of the year alone, nominal spreads to the Treasury curve for par 30-year MBS have widened by 19 bp and OAS by 13 bp with spreads on 5-year investment grade CDS wider by less than 7 bp.
Exhibit 2: MBS spreads continue to widen faster than corporate spreads

Source: Bloomberg, Amherst Pierpont Securities
Banks and mutual funds could replace Fed demand for MBS, but the latest numbers suggest otherwise—at least for now.
Banks
Banks recently have started shrinking their balance sheet, with their $22.6 trillion in assets and $20.6 trillion in liabilities both declining. For the four weeks ending February 2, assets declined at an annualized rate of 13.1% and liabilities declined at an annualized rate of 13.9%. After surging in 2020, balance sheet growth has decelerated over the last year before turning negative recently (Exhibit 3).
Exhibit 3: Bank assets and liabilities recently have started to decline
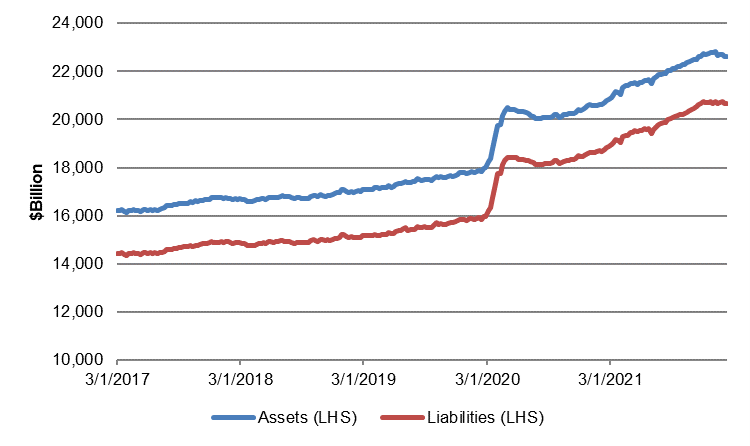
Note: Data through Feb 9, 2022. Source: Bloomberg, Amherst Pierpont Securities
Underneath the broad trends, an aggregate snapshot of US commercial bank balance sheets through February 2 shows some important developments (Exhibit 4). In particular:
- An accelerating reduction in cash assets, which are largely reserves held at the Fed or other banks. Banks’ $3.7 trillion in cash assets—their single largest category—declined in the last six months at an annualized rate of 13.8%, declined in the last three months at an annualized rate of 45.4% and declined in the last month at an annualized rate of 90.5%. Since cash is declining at a much faster pace than other assets, it looks like it’s at least partly getting reallocated to securities and loans.
- Positive but declining rates of growth in securities. Holdings of Treasury and agency debt grew in the last month at an annualized rate of 23.4% while agency MBS and CMBS grew at an annualized rate of 6.5%–a declining pace compared to 6- or 3-month growth. Securities looks like it’s getting some of the cash.
- Mixed results in loans. Some types of loans have looked strong over the last three months including C&I, credit cards and commercial real estate. Over the last month, growth has continued in commercial real estate, auto loans and selected consumer loans
- A recent decline in core deposits. Growth in core deposits, which make up 80.4% of bank funding, has decelerated through the last year before turning negative recently. These deposits usually are the lowest cost funds on the balance sheet. Wholesale borrowings, roughly a tenth the size of core deposits, are also declining.
Exhibit 4: Banks appear to reallocate from cash to securities, CRE, auto and some consumer loans
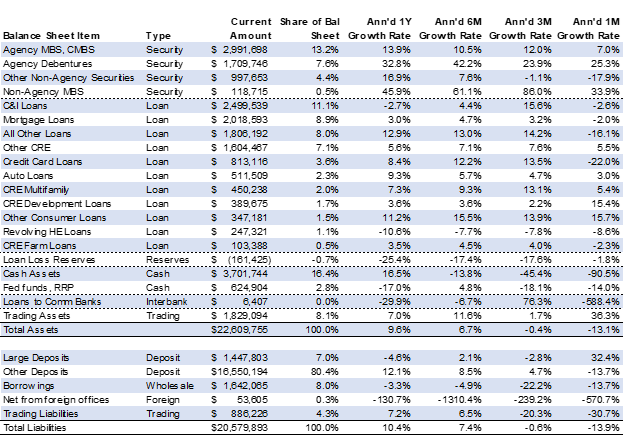
Source: Federal Reserve H.8 through 2 Feb 2022, Amherst Pierpont Securities.
It is too early to conclude that the contraction of bank balance sheets is the start of QT, especially since that only starts when Fed portfolio runoff begins. Deposits are heading out the door for other reasons. Smaller bank balance sheets clearly make it harder for banks to replace Fed demand for Treasury debt and agency MBS.
Fixed income mutual funds and ETFs
Assets under management at bond mutual funds and ETFs also have started shrinking recently after roughly a year of decelerating growth. Rolling 4-week net inflows into bond mutual funds and ETFs ran above $50 billion from May 2020 into late 2021—running above $100 billion as recently as a year ago (Exhibit 5). But for the four weeks ending February 16, the sector lost $40.3 billion of AUM.
Exhibit 5: Inflows into bond mutual funds and ETFs have recently gone negative

Source: ICI, Bloomberg, Amherst Pierpont Securities
Mutual funds and ETFs often get mentioned as a possible source of demand to replace Fed buying of Treasury debt and MBS, and they do hold more than $7 trillion of debt. But low or negative net inflows would make that marginally harder. Managers of active funds instead would have to reallocate from corporate debt or other sectors.
Money market mutual funds
MBS do not fit money market mutual funds, but they could be a beneficiary if cash is leaving bank balance sheets in search of higher rates of interest. But even money market mutual funds have lost assets under management so far this year. Through February 9, fund balances dropped $112 billion or at an annualized rate of 20.6% (Exhibit 6). So far, the flow suggest cash is not leaving banks for money market funds—it’s just leaving the system altogether.
Exhibit 6: Money market mutual funds have also lost AUM
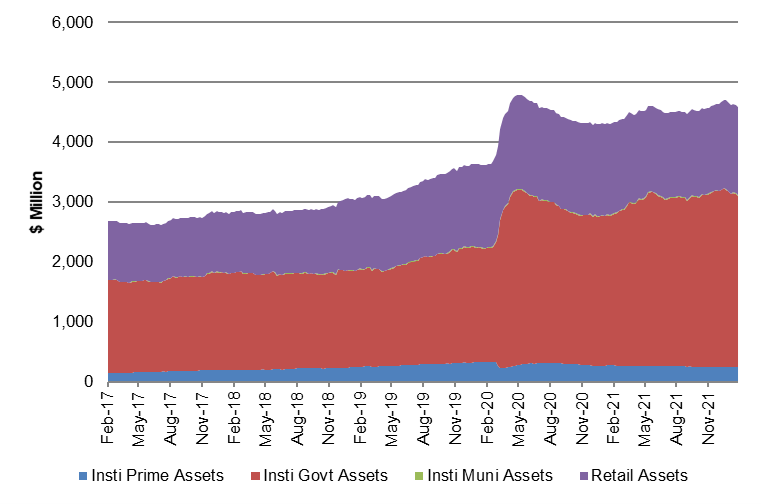
Source: Bloomberg, Amherst Pierpont Securities
At least for the moment, cash available for marginal investing in fixed income at the Fed, banks and key total return funds is falling. These are not the only sources of marginal demand, of course. According to Fed data, foreign portfolios have more than $13 trillion invested in US dollar debt, private and government pensions have more than $5 trillion, life insurers have more than $4 trillion, P&C insurers have more than $1 trillion. Many of these are asset-liability portfolios that have to be largely if not entirely invested. In the Treasury and agency MBS markets where the Fed and banks have dominated for the last two years, these other portfolios increasingly look like they will have to make up the difference.
* * *
The view in rates
The FOMC on January 26 left open the door to a 50 bp hike at some point, but the market does not see that yet for March. Fed funds futures price an average rate of 0.40% for April, the first full month after the March 16 FOMC. By the end of 2022, fed funds futures price a rate of 1.55%, equivalent to slightly less than six 25 bp hikes.
The Fed’s RRP facility is closing Friday with balances near $1.6 trillion, in line with balances for most of this year. Treasury repo remains very soft, so the RRP facility paying 5 bp is a strong alternative.
Settings on 3-month LIBOR have closed Friday at nearly 51 bp, up 15 bp in the last two weeks. Setting on 3-month SOFR have drifted up to nearly 40 bp.
The 10-year note has finished the most recent session at 1.96%, remarkably close to the level of two weeks ago but with lots of volatility in the meantime. The 10-year real rate finished the week at negative 59 bp, down 5 bp over the last two weeks. A more aggressive Fed would start balance sheet normalization earlier, with portfolio runoff taking cash out of the market. That should lift real rates.
The Treasury yield curve has finished its most recent session with 2s10s at 40 bp, flatter by only 4 bp since mid-February week, and 5s30s at 42 bp, steeper by 4 bp over the last two weeks. The curve should continue to flatten.
The view in spreads
Spreads generally look vulnerable while the Fed is calibrating policy to inflation, and the past few weeks has provided good illustration. Of the major spread markets, corporate and structured credit is likely to outperform, as it has since March 2020. Corporates benefit from strong corporate fundamentals and from buyers not tied to Fed policy. The biggest buyers of credit include money managers, international investors and insurers while the only net buyers of MBS during pandemic have been the Fed and banks. Credit buyers continue to have investment demand.
MBS faces pressure as the Fed considers a quick start to runoff. My colleague Brian Landy projects that new supply of MBS will run at $60 billion a month. He also estimates the Fed will need to allow runoff in MBS of more than $30 billion a month. Without the Fed or banks to take up an average of $90 billion in incremental supply, the burden would likely fall on mutual funds. Mutual funds do not have the capital to fully take up the slack.
MBS also faces pressure from new, higher loan limits on Fannie Mae and Freddie Mac MBS. Higher balances bring more negative convexity. Fed taper also reduces the amount of negatively convex loans filtered out of the TBA floating supply. The quality of TBA should erode this year, and spreads widen with it.
The view in credit
Credit fundamentals continue to look strong but could start to soften later this year if the Fed aggressively dampens demand. Corporations have record earnings, good margins, low multiples of debt to gross profits, low debt service and good liquidity. It will be important to watch inflation and see if costs begin to catch up with revenues. A higher real cost of funds would start to eat away at highly leveraged balance sheets with weak or volatile revenues. Consumers last year put on $1 trillion of new debt, starting to releverage the household balance sheet. Rising home prices and rising stock prices have both added to consumer net worth, also now at a record although not equally distributed across households.