The Long and Short
Amazon debt looks attractive to retail, tech peers
This material is a Marketing Communication and does not constitute Independent Investment Research.
With Amazon.com Inc. (AMZN – A1/AA/AA-) straddling both the retail and technology sectors, it’s appropriate to compare AMZN bonds to both ‘A’ and ‘AA’ retail and technology peers.
The company’s cash position provides significant financial flexibility should it want to invest further in the business, pursue mergers and acquisitions, or even pay down debt. Amazon’s net cash position currently stands at $47 billion, and is likely to grow further given its strong cash flow and the fact that the company does not pay a dividend or repurchase shares. That flexibility results in less concern for AMZN than peer Home Depot (HD – A2/A/A) in a rising rate environment; and their long-end bonds look relatively cheap.
In the long-end, AMZN 4.25% 2057 and AMZN 3.25% 2061 bonds actually trade wide to HD 3.5% 2056 bonds (Exhibit 1). While there is roughly a 14-point dollar price differential between the AMZN 4.25% 2057 bonds and the HD bonds, that differential should not be a factor given AMZN’s sizeable cash position relative to HD’s. Furthermore, in the 10-year part of the curve, the trading relationship is reversed, with AMZN trading roughly 8 bp through HD. We view both aforementioned AMZN bonds as attractive for investors looking for yield in higher quality credits.
Exhibit 1. AA/A Technology and Retail 30yr+ Bonds
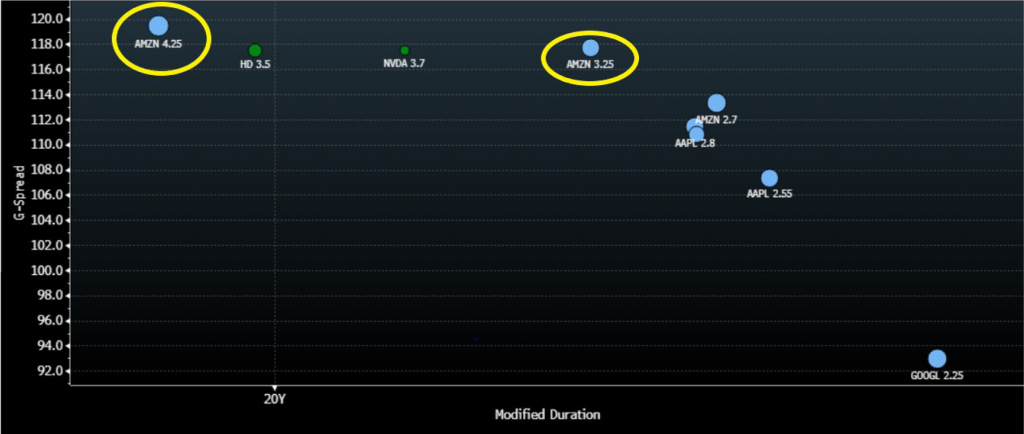
Source: Bloomberg TRACE; Amherst Pierpont Securities
Cash is King
While AMZN posted strong full year results with solid growth in operating income, it was the balance sheet improvement that was really impressive. AMZN ended the year with cash and equivalents of $96 billion, which we note was up from $84 billion in the year ago period. AMZN is on track to exceed $100 billion of cash and equivalents in 2022, joining the ranks of technology giants including MSFT, AAPL and GOOGL. For comparison purposes, we note that HD’s cash position stood at just over $5 billion at the end of 3Q. To further drive our point on how large AMZN’s cash position is, if both AMZN and HD were to cease generating free cash flow, AMZN could repay all of its debt and still have over $40 billion of cash left, while HD’s cash position would only be enough to repay debt maturities through 2024. That said, refinancing risk due to higher rates is less of a concern for AMZN than HD.
Margins Have Come a Long Way
As recently as four years ago, AMZN’s EBITDA margin was in the single-digit category as the company was focused on making long-term investments in the business, including the Prime service and the grocery business. We note that AMZN ended fiscal 2017 with an EBITDA margin of 8.8%, which was well below margins of other retailers. For the same time period, we note that HD’s EBITDA margin was nearly double that of AMZN at 16.6%. Fast forward to 2021, AMZN’s EBITDA margin was 13.7% with HD’s margin for the year estimated to be roughly 17.1%. Street estimates put AMZN’s EBITDA margin ahead of HD’s by fiscal 2024. In fact, AMZN is expected to achieve EBITDA margins of 20% by fiscal 2025.
Exhibit 2. AMZN vs. HD EBITDA Margin Comparison (2015-2025E)
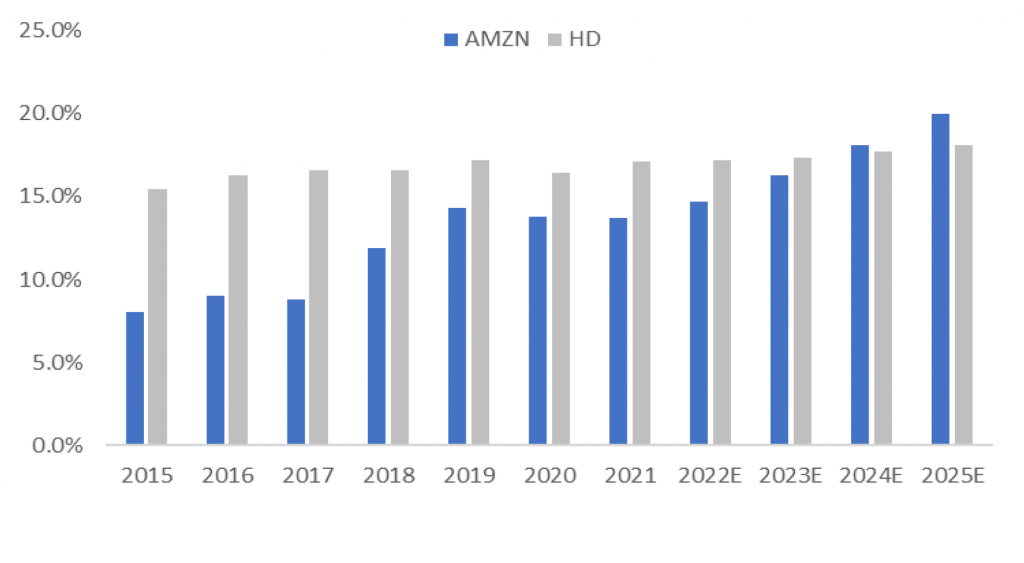
Source: Bloomberg; Company Reports; Amherst Pierpont Securities
While AMZN’s recently announced annual increase in its Prime membership (from $119 to $139) should help to offset inflation (including increased energy and transportation expenses), it is the company’s Web Services (AWS) business that is really driving margins. AWS witnessed robust revenue growth in the quarter of 40% and is now a $71 billion annualized run rate business (up from $51 billion). AWS’ operating margin is now roughly 30% and is expected to trend higher as growth in higher margin Platform-as-a-Service becomes a larger piece of the AWS revenue pie. AWS has had some major contract wins including Nasdaq, Meta and Best Buy to name few.
Ratings Could Trend Higher
AMZN witnessed an upgrade by all three ratings agencies in 2021, reflecting its strong operating performance. We note that Moody’s is the only agency that still rates the company in the single-A category. While Moody’s maintains a stable outlook on the rating, it did note that it would consider an upgrade if AMZN’s investments continue to generate good profitability and retained cash flow/debt is maintained around the 65% area. Given the continued growth in both cash on hand and net cash, coupled with management’s conservative financial policies with respect to shareholder remuneration, Moody’s may need to reconsider its current A1 rating. Additionally, further robust growth in the AWS segment, leading to a higher overall margin profile, should support an upgrade.
This material is intended only for institutional investors and does not carry all of the independence and disclosure standards of retail debt research reports. In the preparation of this material, the author may have consulted or otherwise discussed the matters referenced herein with one or more of SCM’s trading desks, any of which may have accumulated or otherwise taken a position, long or short, in any of the financial instruments discussed in or related to this material. Further, SCM may act as a market maker or principal dealer and may have proprietary interests that differ or conflict with the recipient hereof, in connection with any financial instrument discussed in or related to this material.
This message, including any attachments or links contained herein, is subject to important disclaimers, conditions, and disclosures regarding Electronic Communications, which you can find at https://portfolio-strategy.apsec.com/sancap-disclaimers-and-disclosures.
Important Disclaimers
Copyright © 2026 Santander US Capital Markets LLC and its affiliates (“SCM”). All rights reserved. SCM is a member of FINRA and SIPC. This material is intended for limited distribution to institutions only and is not publicly available. Any unauthorized use or disclosure is prohibited.
In making this material available, SCM (i) is not providing any advice to the recipient, including, without limitation, any advice as to investment, legal, accounting, tax and financial matters, (ii) is not acting as an advisor or fiduciary in respect of the recipient, (iii) is not making any predictions or projections and (iv) intends that any recipient to which SCM has provided this material is an “institutional investor” (as defined under applicable law and regulation, including FINRA Rule 4512 and that this material will not be disseminated, in whole or part, to any third party by the recipient.
The author of this material is an economist, desk strategist or trader. In the preparation of this material, the author may have consulted or otherwise discussed the matters referenced herein with one or more of SCM’s trading desks, any of which may have accumulated or otherwise taken a position, long or short, in any of the financial instruments discussed in or related to this material. Further, SCM or any of its affiliates may act as a market maker or principal dealer and may have proprietary interests that differ or conflict with the recipient hereof, in connection with any financial instrument discussed in or related to this material.
This material (i) has been prepared for information purposes only and does not constitute a solicitation or an offer to buy or sell any securities, related investments or other financial instruments, (ii) is neither research, a “research report” as commonly understood under the securities laws and regulations promulgated thereunder nor the product of a research department, (iii) or parts thereof may have been obtained from various sources, the reliability of which has not been verified and cannot be guaranteed by SCM, (iv) should not be reproduced or disclosed to any other person, without SCM’s prior consent and (v) is not intended for distribution in any jurisdiction in which its distribution would be prohibited.
In connection with this material, SCM (i) makes no representation or warranties as to the appropriateness or reliance for use in any transaction or as to the permissibility or legality of any financial instrument in any jurisdiction, (ii) believes the information in this material to be reliable, has not independently verified such information and makes no representation, express or implied, with regard to the accuracy or completeness of such information, (iii) accepts no responsibility or liability as to any reliance placed, or investment decision made, on the basis of such information by the recipient and (iv) does not undertake, and disclaims any duty to undertake, to update or to revise the information contained in this material.
Unless otherwise stated, the views, opinions, forecasts, valuations, or estimates contained in this material are those solely of the author, as of the date of publication of this material, and are subject to change without notice. The recipient of this material should make an independent evaluation of this information and make such other investigations as the recipient considers necessary (including obtaining independent financial advice), before transacting in any financial market or instrument discussed in or related to this material.
Important disclaimers for clients in the EU and UK
This publication has been prepared by Trading Desk Strategists within the Sales and Trading functions of Santander US Capital Markets LLC (“SanCap”), the US registered broker-dealer of Santander Corporate & Investment Banking. This communication is distributed in the EEA by Banco Santander S.A., a credit institution registered in Spain and authorised and regulated by the Bank of Spain and the CNMV. Any EEA recipient of this communication that would like to affect any transaction in any security or issuer discussed herein should do so with Banco Santander S.A. or any of its affiliates (together “Santander”). This communication has been distributed in the UK by Banco Santander, S.A.’s London branch, authorised by the Bank of Spain and subject to regulatory oversight on certain matters by the Financial Conduct Authority (FCA) and the Prudential Regulation Authority (PRA).
The publication is intended for exclusive use for Professional Clients and Eligible Counterparties as defined by MiFID II and is not intended for use by retail customers or for any persons or entities in any jurisdictions or country where such distribution or use would be contrary to local law or regulation.
This material is not a product of Santander´s Research Team and does not constitute independent investment research. This is a marketing communication and may contain ¨investment recommendations¨ as defined by the Market Abuse Regulation 596/2014 ("MAR"). This publication has not been prepared in accordance with legal requirements designed to promote the independence of research and is not subject to any prohibition on dealing ahead of the dissemination of investment research. The author, date and time of the production of this publication are as indicated herein.
This publication does not constitute investment advice and may not be relied upon to form an investment decision, nor should it be construed as any offer to sell or issue or invitation to purchase, acquire or subscribe for any instruments referred herein. The publication has been prepared in good faith and based on information Santander considers reliable as of the date of publication, but Santander does not guarantee or represent, express or implied, that such information is accurate or complete. All estimates, forecasts and opinions are current as at the date of this publication and are subject to change without notice. Unless otherwise indicated, Santander does not intend to update this publication. The views and commentary in this publication may not be objective or independent of the interests of the Trading and Sales functions of Santander, who may be active participants in the markets, investments or strategies referred to herein and/or may receive compensation from investment banking and non-investment banking services from entities mentioned herein. Santander may trade as principal, make a market or hold positions in instruments (or related derivatives) and/or hold financial interest in entities discussed herein. Santander may provide market commentary or trading strategies to other clients or engage in transactions which may differ from views expressed herein. Santander may have acted upon the contents of this publication prior to you having received it.
This publication is intended for the exclusive use of the recipient and must not be reproduced, redistributed or transmitted, in whole or in part, without Santander’s consent. The recipient agrees to keep confidential at all times information contained herein.


