By the Numbers
A blowout December, moderating but sustainable prices for CRE
This material is a Marketing Communication and does not constitute Independent Investment Research.
December 2021 marked a banner month for commercial real estate transactions, and the momentum appears likely to continue into 2022. CRE property price growth across most sectors appears to be moderating after exceptional gains during the pandemic. Fundamentals remain positive for multifamily and industrial properties, while prices for office properties remain broadly subdued. The outlook for inflation remains an important consideration for investors, as some academic studies show real estate serves as an effective partial hedge against inflation.
Commercial real estate transactions surged in December.
Repeat sales transactions through most of last year had been running from 1,300 to 2,200 a month but jumped in December to 3,100 (Exhibit 1). December is typically a heavy month for CRE sales, but the last two years the number of December transactions rose above the year’s monthly average by nearly 50%. Sales activity slowed markedly during the early months of the pandemic in 2020, from about 1,500 a month to well below 1,000. By September of 2020 CRE transactions increased back above 1,300 and continued surging higher. In the second half of 2021 there were about 2,200 sales a month with a jump in December to 3,100. The increase in sales was across both investment grade and general CRE properties. Of the $35 billion in CRE transactions in December 2021, $25 billion was for investment grade properties, as defined by CoStar.
Exhibit 1: CRE transaction history
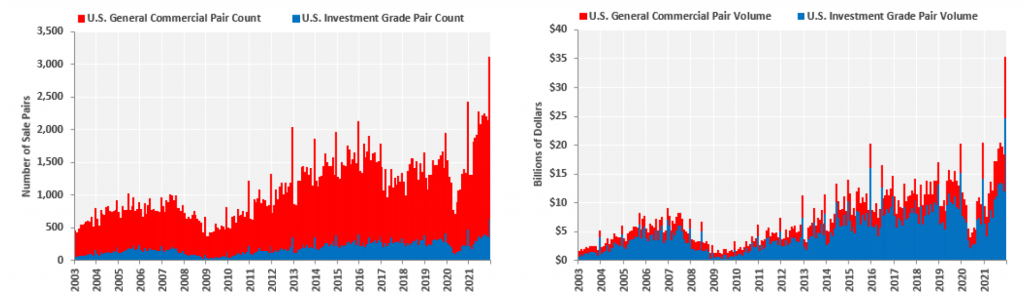
Note: Monthly data through December 2021.
Source: CoStar
Distressed sales have remained depressed both outright and as a share of CRE transactions
What has not yet materialized is a significant increase in distressed sales due to the pandemic. Distressed sales hit an all-time low as percentage of transactions in December of 1.16% (Exhibit 2, left-hand graph) but this is partly due to the surge in overall activity. The number of distressed sales (Exhibit 2, right-hand graph) ticked up modestly from about 35 to 45 a month in the third quarter of 2021, before declining back to the low 30s, where it’s been since 2017. Distressed sales are almost certain to rise in 2022, but strong CRE property price appreciation will likely limit the number of sales to well below the recent peaks seen in 2010 to 2014.
Exhibit 2: CRE transactions that are distressed sales
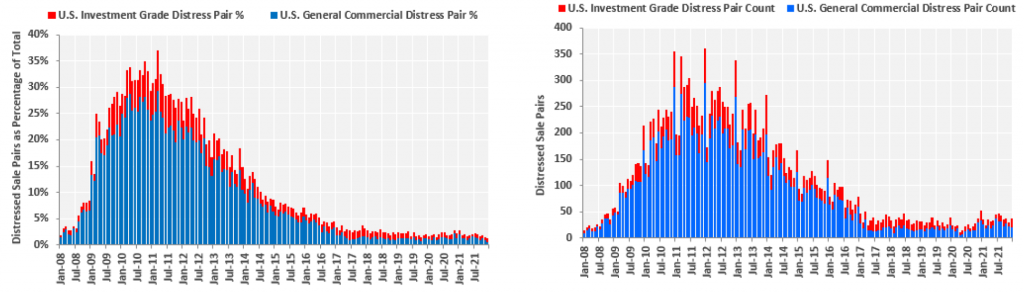
Note: Monthly data through December 2021.
Source: CoStar
The pandemic-fueled growth in CRE property prices is showing signs of moderation
Property price increases began to decelerate for multifamily in the second half of 2021 (Exhibit 3, left-hand graph). Multifamily property prices rose by 5.9% quarter-over-quarter in 2Q of 2021, a recent peak, before moderating to a 3.8% increase in the third quarter and slowing further to up 2.0% in the fourth quarter of 2021. That still leaves multifamily properties up 15.6% for the calendar year of 2021, and up 27.3% compared to pre-pandemic levels. That is the strongest price appreciation through the pandemic of any major property type (industrial +26.4%, land +19.2%, retail +17.3%, office +13.5%, hospitality +0.4% from pre-pandemic).
Exhibit 3: CRE prices by property type
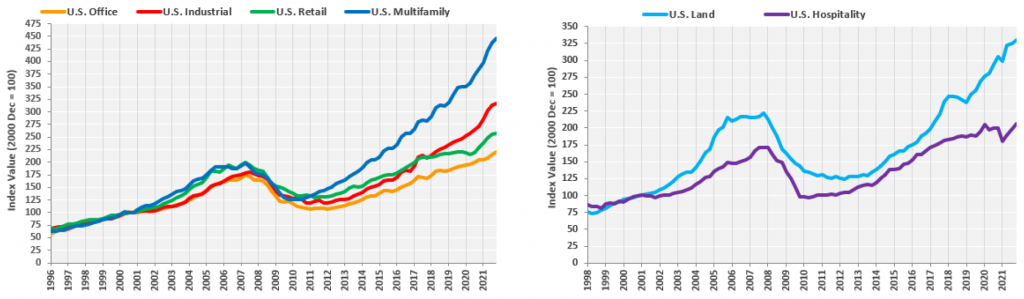
Note: Equal weighted indices, quarterly data. Data through December 2021.
Source: CoStar
A considerable amount of agency CMBS prepayment activity during the pandemic was driven in part by borrowers taking out equity thanks to the rapid rise in property prices. As that moderates and rates rise, prepayment activity should fall rapidly. The recent rise in conduit CMBS, CRE CLOs and SASB issuance could stay elevated through the first half of 2022 as CRE transaction activity remains strong.
Have real estate prices crossed into bubble territory?
It’s a reasonable question to ask if real estate prices reflect a bubble, but so far the price increases appear definitively related to mismatches between economic and demographic factors driving supply and demand – not artificial demand created by low interest rates and easy credit standards. For example, the decade-long rise in multifamily property prices before to the pandemic is due to a dramatic drop in home building activity, which crimped supply, despite growing demand from millennials seeking to form new households. The pandemic-fueled surge in demand for housing has so far returned single-family and multifamily home building to reasonable levels. The increase in home construction will still require close to a decade to close the gap based on a decade of underbuilding and a projected long-term shift towards more renter than homeowner households.
The rise in industrial property prices can be summed up in a few words: Amazon, Fed Ex and shipping. The shift in delivery models and consumer migration towards more online shopping is likely permanent, even if it comes off the pandemic high. Depending on how sticky the remote working trend is, prices for office properties in dense, very expensive metro areas such as New York and San Francisco could be subdued for years.
It is possible that the specter of long-term inflation could be luring more investors into real estate, temporarily putting upward pressure on prices. There is a substantial body of academic and financial market research that attempts to determine which asset classes are good hedges against inflation. The primary asset classes evaluated include common stocks, gold, fixed income securities and real estate. The research studies date back to 1930 and the data, methods and results across most asset classes are somewhat inconsistent to, in some instances, wildly conflicting. This will be a topic of a future strategy missive, but here are some boiled down conclusions:
- The asset that provides the best hedge against inflation – meaning the returns of the asset are positively correlated to inflation – are inflation-linked securities
- The next best asset may be real estate, but with a few caveats:
- Real estate appears to hedge inflation best over long periods of time, though at best it provides a partial hedge
- Direct real estate holdings may work better than indirect holdings in publicly traded REITs, though there are conflicting studies which are sensitive to the time period chosen for evaluation and the sophistication of the regression model being used
- Real estate probably hedges expected inflation better than unexpected inflation, though that seems to be true of most asset classes with the exception of inflation-linked securities.
Long-term trends across regions
Property prices follow economic activity which follows migration of people. The Midwest has been losing people and businesses to the South and the coasts for a decade, and it shows in the broad underperformance of their real estate sector (Exhibit 4).
Exhibit 4: CRE prices by region
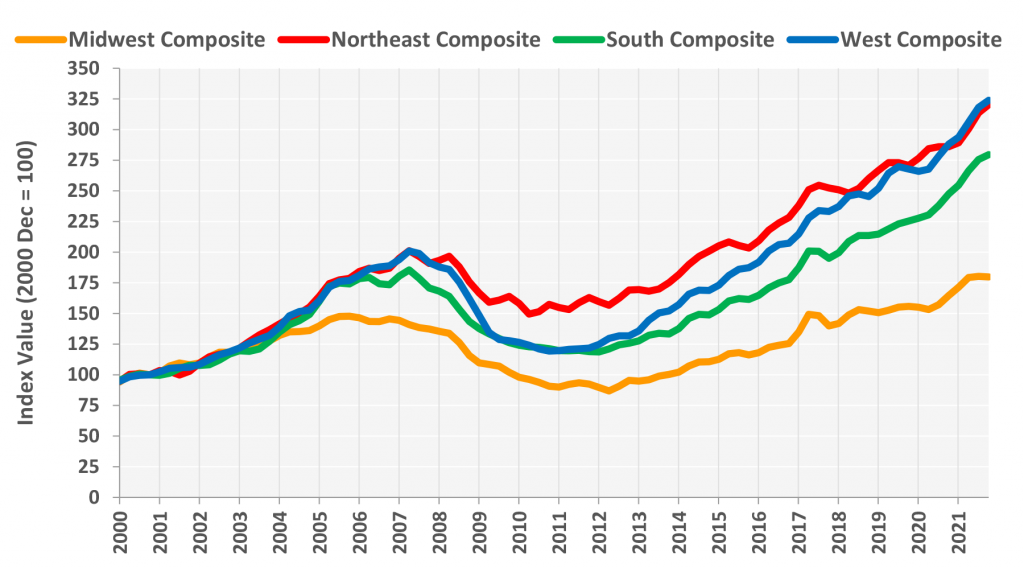
Note: Equal weighted indices, quarterly data. Data through December 2021.
Source: CoStar
The Northeast suffered the least overall depreciation after the housing crisis and continues to hold its own. However, the migration out of the northeast to the south and west has fueled outperformance for a decade, and that’s unlikely to turn around in the 2020s.
This material is intended only for institutional investors and does not carry all of the independence and disclosure standards of retail debt research reports. In the preparation of this material, the author may have consulted or otherwise discussed the matters referenced herein with one or more of SCM’s trading desks, any of which may have accumulated or otherwise taken a position, long or short, in any of the financial instruments discussed in or related to this material. Further, SCM may act as a market maker or principal dealer and may have proprietary interests that differ or conflict with the recipient hereof, in connection with any financial instrument discussed in or related to this material.
This message, including any attachments or links contained herein, is subject to important disclaimers, conditions, and disclosures regarding Electronic Communications, which you can find at https://portfolio-strategy.apsec.com/sancap-disclaimers-and-disclosures.
Important Disclaimers
Copyright © 2026 Santander US Capital Markets LLC and its affiliates (“SCM”). All rights reserved. SCM is a member of FINRA and SIPC. This material is intended for limited distribution to institutions only and is not publicly available. Any unauthorized use or disclosure is prohibited.
In making this material available, SCM (i) is not providing any advice to the recipient, including, without limitation, any advice as to investment, legal, accounting, tax and financial matters, (ii) is not acting as an advisor or fiduciary in respect of the recipient, (iii) is not making any predictions or projections and (iv) intends that any recipient to which SCM has provided this material is an “institutional investor” (as defined under applicable law and regulation, including FINRA Rule 4512 and that this material will not be disseminated, in whole or part, to any third party by the recipient.
The author of this material is an economist, desk strategist or trader. In the preparation of this material, the author may have consulted or otherwise discussed the matters referenced herein with one or more of SCM’s trading desks, any of which may have accumulated or otherwise taken a position, long or short, in any of the financial instruments discussed in or related to this material. Further, SCM or any of its affiliates may act as a market maker or principal dealer and may have proprietary interests that differ or conflict with the recipient hereof, in connection with any financial instrument discussed in or related to this material.
This material (i) has been prepared for information purposes only and does not constitute a solicitation or an offer to buy or sell any securities, related investments or other financial instruments, (ii) is neither research, a “research report” as commonly understood under the securities laws and regulations promulgated thereunder nor the product of a research department, (iii) or parts thereof may have been obtained from various sources, the reliability of which has not been verified and cannot be guaranteed by SCM, (iv) should not be reproduced or disclosed to any other person, without SCM’s prior consent and (v) is not intended for distribution in any jurisdiction in which its distribution would be prohibited.
In connection with this material, SCM (i) makes no representation or warranties as to the appropriateness or reliance for use in any transaction or as to the permissibility or legality of any financial instrument in any jurisdiction, (ii) believes the information in this material to be reliable, has not independently verified such information and makes no representation, express or implied, with regard to the accuracy or completeness of such information, (iii) accepts no responsibility or liability as to any reliance placed, or investment decision made, on the basis of such information by the recipient and (iv) does not undertake, and disclaims any duty to undertake, to update or to revise the information contained in this material.
Unless otherwise stated, the views, opinions, forecasts, valuations, or estimates contained in this material are those solely of the author, as of the date of publication of this material, and are subject to change without notice. The recipient of this material should make an independent evaluation of this information and make such other investigations as the recipient considers necessary (including obtaining independent financial advice), before transacting in any financial market or instrument discussed in or related to this material.
Important disclaimers for clients in the EU and UK
This publication has been prepared by Trading Desk Strategists within the Sales and Trading functions of Santander US Capital Markets LLC (“SanCap”), the US registered broker-dealer of Santander Corporate & Investment Banking. This communication is distributed in the EEA by Banco Santander S.A., a credit institution registered in Spain and authorised and regulated by the Bank of Spain and the CNMV. Any EEA recipient of this communication that would like to affect any transaction in any security or issuer discussed herein should do so with Banco Santander S.A. or any of its affiliates (together “Santander”). This communication has been distributed in the UK by Banco Santander, S.A.’s London branch, authorised by the Bank of Spain and subject to regulatory oversight on certain matters by the Financial Conduct Authority (FCA) and the Prudential Regulation Authority (PRA).
The publication is intended for exclusive use for Professional Clients and Eligible Counterparties as defined by MiFID II and is not intended for use by retail customers or for any persons or entities in any jurisdictions or country where such distribution or use would be contrary to local law or regulation.
This material is not a product of Santander´s Research Team and does not constitute independent investment research. This is a marketing communication and may contain ¨investment recommendations¨ as defined by the Market Abuse Regulation 596/2014 ("MAR"). This publication has not been prepared in accordance with legal requirements designed to promote the independence of research and is not subject to any prohibition on dealing ahead of the dissemination of investment research. The author, date and time of the production of this publication are as indicated herein.
This publication does not constitute investment advice and may not be relied upon to form an investment decision, nor should it be construed as any offer to sell or issue or invitation to purchase, acquire or subscribe for any instruments referred herein. The publication has been prepared in good faith and based on information Santander considers reliable as of the date of publication, but Santander does not guarantee or represent, express or implied, that such information is accurate or complete. All estimates, forecasts and opinions are current as at the date of this publication and are subject to change without notice. Unless otherwise indicated, Santander does not intend to update this publication. The views and commentary in this publication may not be objective or independent of the interests of the Trading and Sales functions of Santander, who may be active participants in the markets, investments or strategies referred to herein and/or may receive compensation from investment banking and non-investment banking services from entities mentioned herein. Santander may trade as principal, make a market or hold positions in instruments (or related derivatives) and/or hold financial interest in entities discussed herein. Santander may provide market commentary or trading strategies to other clients or engage in transactions which may differ from views expressed herein. Santander may have acted upon the contents of this publication prior to you having received it.
This publication is intended for the exclusive use of the recipient and must not be reproduced, redistributed or transmitted, in whole or in part, without Santander’s consent. The recipient agrees to keep confidential at all times information contained herein.


