The Big Idea
Shelter costs could confound the Fed
This material is a Marketing Communication and does not constitute Independent Investment Research.
CPI measures of shelter costs, rent and owners’ equivalent rent tend to lag measures of home prices by about 18 to 24 months, according to work by the Dallas Fed. Rising home prices since the onset of pandemic should drive up shelter costs for much 2022 and 2023. In fact, the Dallas Fed work predicts shelter costs will ultimately surge to a year-over-year pace around 7%. This run-up has begun, but rent and OER are still only running year-over-year around 3% to 4%. A measure of rents published by Zillow offers an updated read that also suggests shelter costs have far to go this year. That is likely to make it difficult for consumer price inflation to moderate as much as Fed officials hope.
Zillow observed rent index
Zillow collects a variety of housing data, most prominently on home prices from its extensive database. Beginning in 2020, the firm has published its Zillow Observed Rent Index (ZORI). Zillow collects rent information from listings on its site, which has allowed it to collect what it calls an “industry leading database of rental properties.” Like the Federal Housing Finance Agency and S&P CoreLogic Case-Shiller measures of home prices, the ZORI uses a repeated transaction methodology. That is, it looks at rents on the same properties over time to determine the change in rent prices, which avoids issues with compositional changes in Zillow’s listings.
Zillow researchers weight their observations using Census Bureau data on the universe of housing units to make sure that the index offers a fair representation of the overall housing market. Zillow has indices for the 100 largest metropolitan areas in the U.S. and is working on expanding geographic coverage. But the company also publishes a U.S. national index. Unfortunately, the data only go back to 2014, so the history is limited.
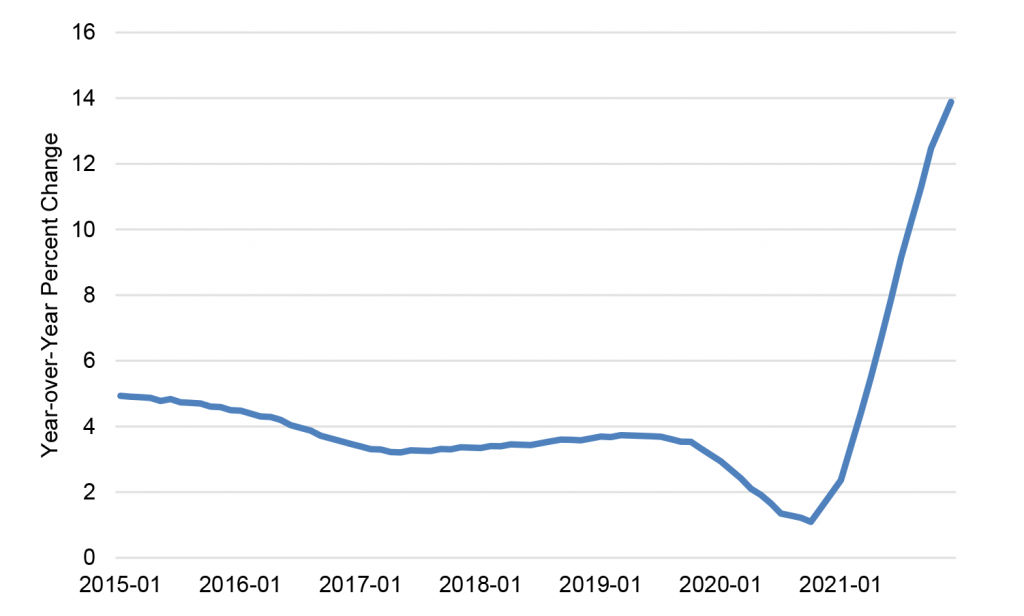
The ZORI ran in the 3%-to-4% range in the years before the pandemic, dipped as low as 1.1% in 2020 due to COVID lockdowns, and has ripped higher since late 2020 (Exhibit 1). The year-over-year advance jumped to 13.9% in December, and the gauge has risen at a 15% annualized pace over the past six months, suggesting that it has not yet peaked.
Exhibit 1: Zillow Observed Rent Index has accelerated in the last year
Source: Zillow.
Mapping ZORI to the CPI
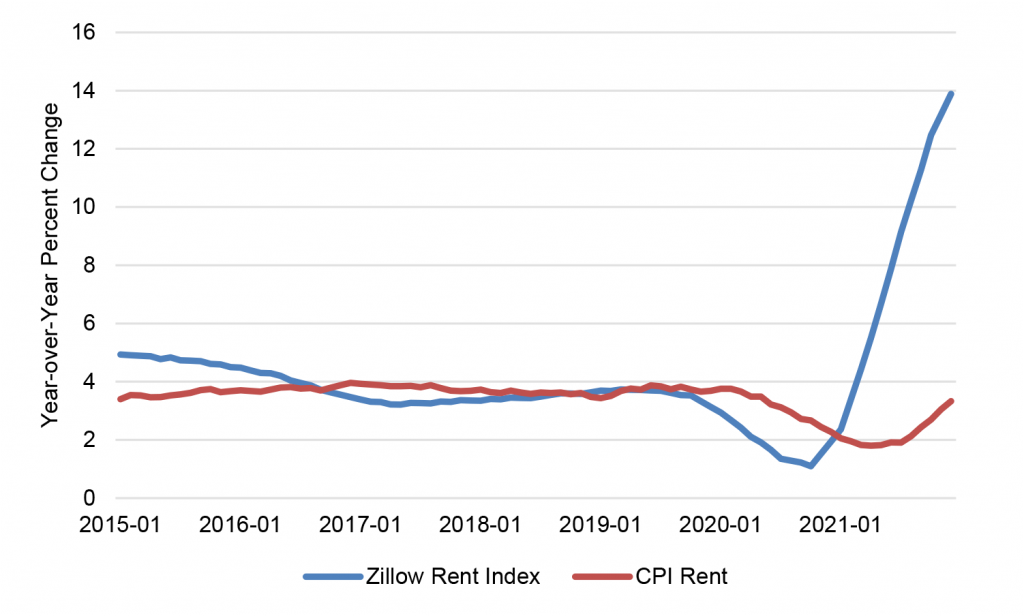
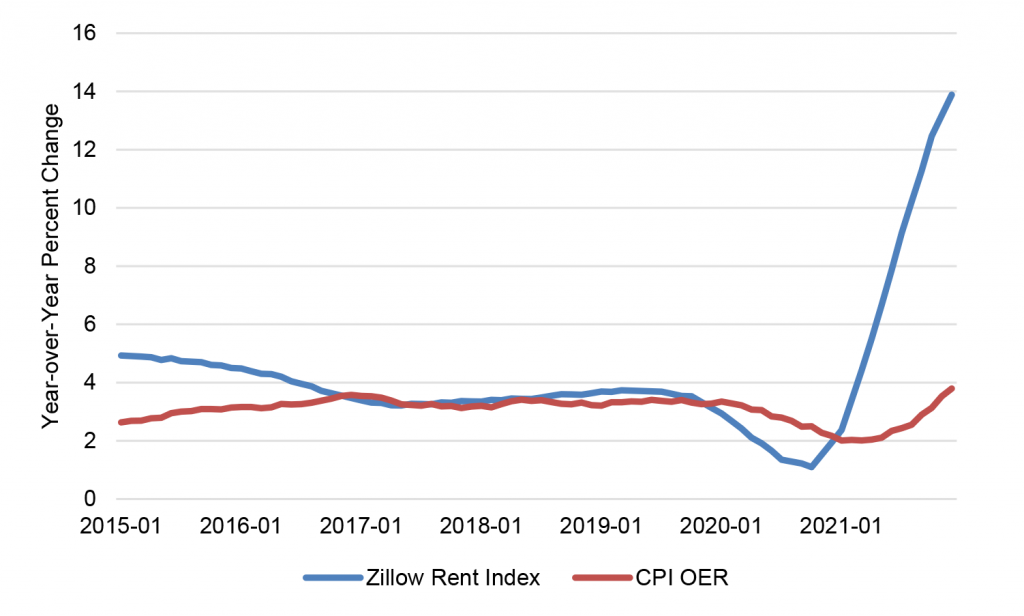
Though there is limited history of the Zillow index, we can look at how movements in the ZORI compare to swings in the CPI measures of rent and OER (Exhibit 2 and Exhibit 3).
Exhibit 2: Zillow Observed Rent Index and CPI rent
Source: Zillow, BLS.
Exhibit 3: Zillow Observed Rent Index and CPI owners’ equivalent rent
Source: Zillow, BLS.
The first feature to compare is the timing of the turns. The year-over-year rise in the ZORI began to decelerate in August 2019 and bottomed out in October 2020 before turning sharply higher. The CPI rent gauge remained steady on a year-over-year basis until the Covid lockdowns in April 2020—eight months behind the ZORI—and bottomed in April 2021—six months behind the ZORI—before turning up in earnest in August. The OER component of the CPI bottomed on a year-over-year basis in March 2020 and turned up significantly beginning in June 2021. The ZORI appears to lead the CPI shelter costs measures, at least in terms of turning points, by around eight months.
As for relative magnitudes, the ZORI gauge decelerated by around 260 bp from the 2019 peak to the late-2020 bottom. By comparison, the CPI gauges of rent and OER moderated by about 190 bp and 130 bp.
On the way back up, the ZORI has exploded at a pace that the CPI gauges are unlikely to replicate. Since beginning to accelerate noticeably last summer, the rent and OER measures have sped up by around 150 bp in about six months. In contrast, the ZORI year-over-year advance picked up by close to 400 bp in the first six months after bottoming out.
Since then, the ZORI has accelerated by another 840 bp, which suggests that the CPI gauges may have at least another 300 bp to go before the end of 2022. That would put rent and OER in the 6% to 7% range by late 2022, not far from where Dallas Fed researchers estimated using a regression against the Zillow home price index, though they had it taking until late 2023 to get there.
In any case, rent and OER represent about 40% of the core CPI and 20% of the core PCE deflator. Focusing on the latter, a 300 bp acceleration in shelter costs in 2022 would add about 60 bp to the year-over-year advance in the core PCE deflator.
To put that into context, if new and used motor vehicles reversed the entire increase seen in 2021 through November—roughly 10% for new vehicles and 40% for used vehicles, which seems like an unrealistically aggressive assumption—it would subtract around 70 bp from the core PCE deflator in 2022. A more realistic assumption for motor vehicles might be for half that much of a decline, and that would only happen if supply constraints were entirely resolved before the end of the year, a prospect that is looking less likely by the day.
The FOMC’s December SEP economic projections call for a deceleration in the core PCE deflator on a Q4-to-Q4 basis of about 200 bp this year. It is hard to see how that can happen if the largest chunk of the core, shelter costs, is accelerating by enough to offset or, more likely, more than offset the clearest candidate driving a slowdown.
This material is intended only for institutional investors and does not carry all of the independence and disclosure standards of retail debt research reports. In the preparation of this material, the author may have consulted or otherwise discussed the matters referenced herein with one or more of SCM’s trading desks, any of which may have accumulated or otherwise taken a position, long or short, in any of the financial instruments discussed in or related to this material. Further, SCM may act as a market maker or principal dealer and may have proprietary interests that differ or conflict with the recipient hereof, in connection with any financial instrument discussed in or related to this material.
This message, including any attachments or links contained herein, is subject to important disclaimers, conditions, and disclosures regarding Electronic Communications, which you can find at https://portfolio-strategy.apsec.com/sancap-disclaimers-and-disclosures.
Important Disclaimers
Copyright © 2026 Santander US Capital Markets LLC and its affiliates (“SCM”). All rights reserved. SCM is a member of FINRA and SIPC. This material is intended for limited distribution to institutions only and is not publicly available. Any unauthorized use or disclosure is prohibited.
In making this material available, SCM (i) is not providing any advice to the recipient, including, without limitation, any advice as to investment, legal, accounting, tax and financial matters, (ii) is not acting as an advisor or fiduciary in respect of the recipient, (iii) is not making any predictions or projections and (iv) intends that any recipient to which SCM has provided this material is an “institutional investor” (as defined under applicable law and regulation, including FINRA Rule 4512 and that this material will not be disseminated, in whole or part, to any third party by the recipient.
The author of this material is an economist, desk strategist or trader. In the preparation of this material, the author may have consulted or otherwise discussed the matters referenced herein with one or more of SCM’s trading desks, any of which may have accumulated or otherwise taken a position, long or short, in any of the financial instruments discussed in or related to this material. Further, SCM or any of its affiliates may act as a market maker or principal dealer and may have proprietary interests that differ or conflict with the recipient hereof, in connection with any financial instrument discussed in or related to this material.
This material (i) has been prepared for information purposes only and does not constitute a solicitation or an offer to buy or sell any securities, related investments or other financial instruments, (ii) is neither research, a “research report” as commonly understood under the securities laws and regulations promulgated thereunder nor the product of a research department, (iii) or parts thereof may have been obtained from various sources, the reliability of which has not been verified and cannot be guaranteed by SCM, (iv) should not be reproduced or disclosed to any other person, without SCM’s prior consent and (v) is not intended for distribution in any jurisdiction in which its distribution would be prohibited.
In connection with this material, SCM (i) makes no representation or warranties as to the appropriateness or reliance for use in any transaction or as to the permissibility or legality of any financial instrument in any jurisdiction, (ii) believes the information in this material to be reliable, has not independently verified such information and makes no representation, express or implied, with regard to the accuracy or completeness of such information, (iii) accepts no responsibility or liability as to any reliance placed, or investment decision made, on the basis of such information by the recipient and (iv) does not undertake, and disclaims any duty to undertake, to update or to revise the information contained in this material.
Unless otherwise stated, the views, opinions, forecasts, valuations, or estimates contained in this material are those solely of the author, as of the date of publication of this material, and are subject to change without notice. The recipient of this material should make an independent evaluation of this information and make such other investigations as the recipient considers necessary (including obtaining independent financial advice), before transacting in any financial market or instrument discussed in or related to this material.
Important disclaimers for clients in the EU and UK
This publication has been prepared by Trading Desk Strategists within the Sales and Trading functions of Santander US Capital Markets LLC (“SanCap”), the US registered broker-dealer of Santander Corporate & Investment Banking. This communication is distributed in the EEA by Banco Santander S.A., a credit institution registered in Spain and authorised and regulated by the Bank of Spain and the CNMV. Any EEA recipient of this communication that would like to affect any transaction in any security or issuer discussed herein should do so with Banco Santander S.A. or any of its affiliates (together “Santander”). This communication has been distributed in the UK by Banco Santander, S.A.’s London branch, authorised by the Bank of Spain and subject to regulatory oversight on certain matters by the Financial Conduct Authority (FCA) and the Prudential Regulation Authority (PRA).
The publication is intended for exclusive use for Professional Clients and Eligible Counterparties as defined by MiFID II and is not intended for use by retail customers or for any persons or entities in any jurisdictions or country where such distribution or use would be contrary to local law or regulation.
This material is not a product of Santander´s Research Team and does not constitute independent investment research. This is a marketing communication and may contain ¨investment recommendations¨ as defined by the Market Abuse Regulation 596/2014 ("MAR"). This publication has not been prepared in accordance with legal requirements designed to promote the independence of research and is not subject to any prohibition on dealing ahead of the dissemination of investment research. The author, date and time of the production of this publication are as indicated herein.
This publication does not constitute investment advice and may not be relied upon to form an investment decision, nor should it be construed as any offer to sell or issue or invitation to purchase, acquire or subscribe for any instruments referred herein. The publication has been prepared in good faith and based on information Santander considers reliable as of the date of publication, but Santander does not guarantee or represent, express or implied, that such information is accurate or complete. All estimates, forecasts and opinions are current as at the date of this publication and are subject to change without notice. Unless otherwise indicated, Santander does not intend to update this publication. The views and commentary in this publication may not be objective or independent of the interests of the Trading and Sales functions of Santander, who may be active participants in the markets, investments or strategies referred to herein and/or may receive compensation from investment banking and non-investment banking services from entities mentioned herein. Santander may trade as principal, make a market or hold positions in instruments (or related derivatives) and/or hold financial interest in entities discussed herein. Santander may provide market commentary or trading strategies to other clients or engage in transactions which may differ from views expressed herein. Santander may have acted upon the contents of this publication prior to you having received it.
This publication is intended for the exclusive use of the recipient and must not be reproduced, redistributed or transmitted, in whole or in part, without Santander’s consent. The recipient agrees to keep confidential at all times information contained herein.


