By the Numbers
Preparing for a precipitous slowdown in GNPL prepayments
This material is a Marketing Communication and does not constitute Independent Investment Research.
Rising yields in the long end of the curve are driving commercial mortgage rates higher, and multifamily property price appreciation has come off the boil. If sustained, both trends should cause prepayments to slow precipitously in the coming months. If 10-year Treasury rates rise as high as 2.00%, it could lift the standard Ginnie Mae project loan commitment rate into the 2.75% to 3.00% range. Wide dispersion of coupons should continue, but the slowdown in property price appreciation should eventually result in fewer borrowers refinancing into premium loans and taking equity out of the property. That would significantly reduce prepayment speeds in loans with high penalty points attached, which surged during the pandemic.
Based on the recent sell-off, most standard rate, pandemic-vintage Ginnie Mae project loans—those originated at $104 price—are already breakeven to 50 bp out-of-the-money to refinance. A zero to negative refi incentive historically pushes prepay speeds below 3 CPR (Exhibit 1). Loans that have not refinanced but whose coupons remain in the money will likely show signs of burnout, depressing speeds long-term. This was evident in 2018, when rates had risen, and speeds for loans which still had significant prepay incentives were far below normal, averaging 20 CPR instead of being closer to 40 CPR (Exhibit 1). By comparison, during the pandemic the exceptional multifamily property price appreciation helped push prepay speeds well above historical averages for most loans in the money to refinance.
Exhibit 1: Ginnie Mae project loan S-curves by refinance incentive
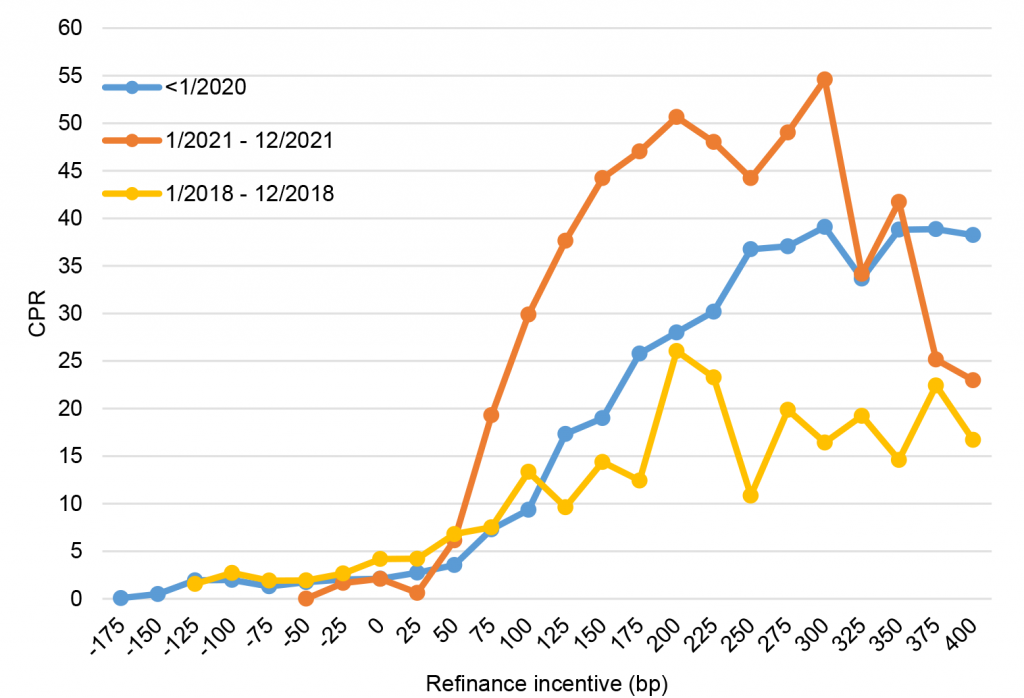
Note: The refinance incentive is calculated as the loan coupon versus the weighted average project loan commitment rate.
Source: Ginnie Mae, Intex, Amherst Pierpont Securities
Prepays recently spiked higher at the end of 2021
The relatively low rates of November and December pushed prepayment speeds higher across agency CMBS. In Ginnie Mae project loans, the weighted average prepayment speed in December was 28.1 CPR (Exhibit 2). This was faster than any other month of 2021 except for February, which had a 32.6 CPR when 10-year Treasury rates were hovering just above 1.00%.
Exhibit 2: Ginnie Mae project loan prepay speeds by vintage
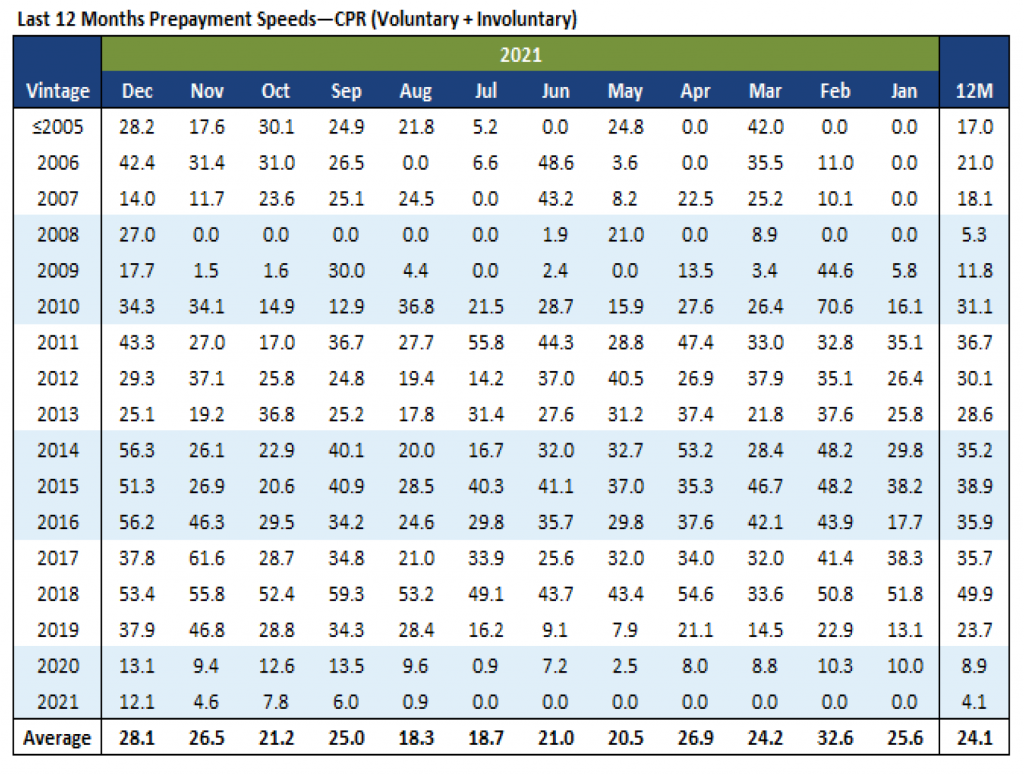
Source: Ginnie Mae, Amherst Pierpont Securities
An important factor driving GNPL prepay speeds is the level of the project loan commitment rate, or PLC rate. This does not tend adjust nearly as quickly as the 10-year Treasury rate or the Ginnie single-family current coupon rate (Exhibit 3). When 10-year Treasury rates were well below 1.00% for much of 2020, the spread between the 10-year Treasury yield and PLC rates was quite high, and PLC rates only gradually came down from 3.5% to 2.5%. Spreads also compressed as rates began to rise, so prepayments and refinances remained attractive.
Exhibit 3: Ginnie Mae project loan commitment rates
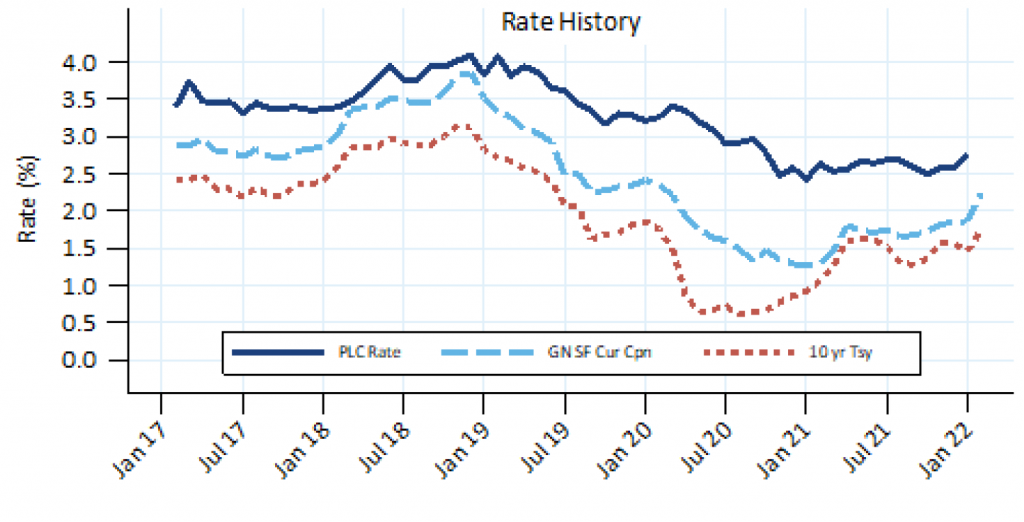
Source: Ginnie Mae, Amherst Pierpont Securities
Prepay speeds accelerated in 2021 across all penalty buckets (Exhibit 4) compared to pre-pandemic averages. The highest speeds were for loans with an 8% penalty premium—meaning the penalty for prepaying the loan is equal to 8% of the outstanding balance—and 0% penalty premium. Speeds for both of those buckets averaged 45 CPR in 2021. This is likely driven by borrowers selling or refinancing properties due to the very strong multifamily property price appreciation that began in the latter half of 2020 and continued throughout 2021, allowing them to more easily roll the cost of the penalties into the new loan due to the increased equity.
Exhibit 4: GNPL S-curves by penalty bucket
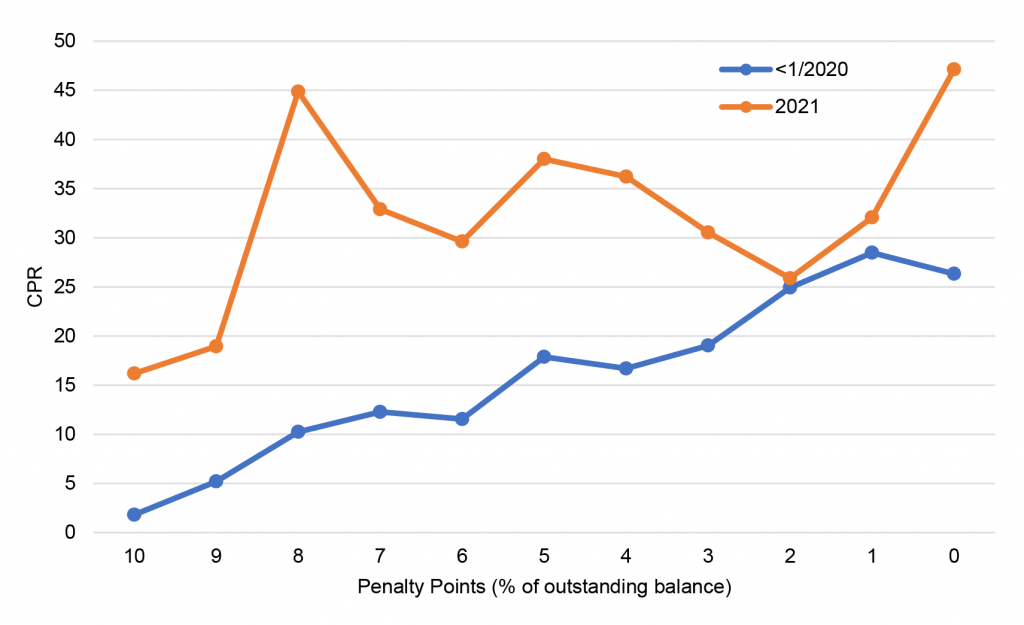
Source: Ginnie Mae, Amherst Pierpont Securities
This was not unique to Ginnie Mae. December prepayment speeds for Freddie and Fannie multifamily aren’t available until next month, but November speeds already show an uptick. In Freddie floating-rate loans (K-F deals) speeds were relatively benign in the first half of 2021 then started to accelerate in the second half as fixed rates began to climb and the Fed indicated the approach of a hiking cycle. Speeds for a selection of Freddie K-F deals in 2021 are shown in Exhibit 5.
Exhibit 5: FHMS K-F floater prepayment speeds (by deal, voluntary)
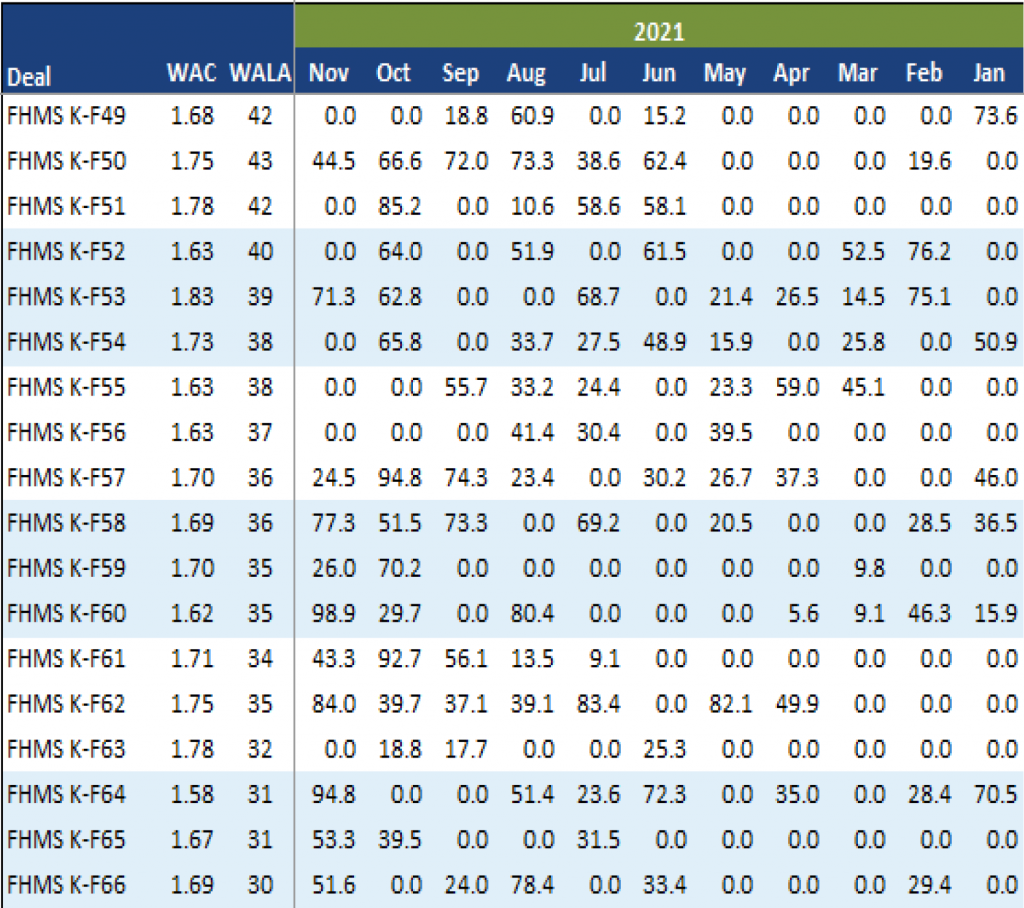
Source: Freddie Mac, Intex, Amherst Pierpont Securities
The strong property price appreciation over the past decade has resulted in a steady flow of Fannie Mae DUS borrowers prepaying their loans despite the yield maintenance or penalty premiums typically required to do so (Exhibit 6).
Exhibit 6: Fannie Mae multifamily loan payoffs
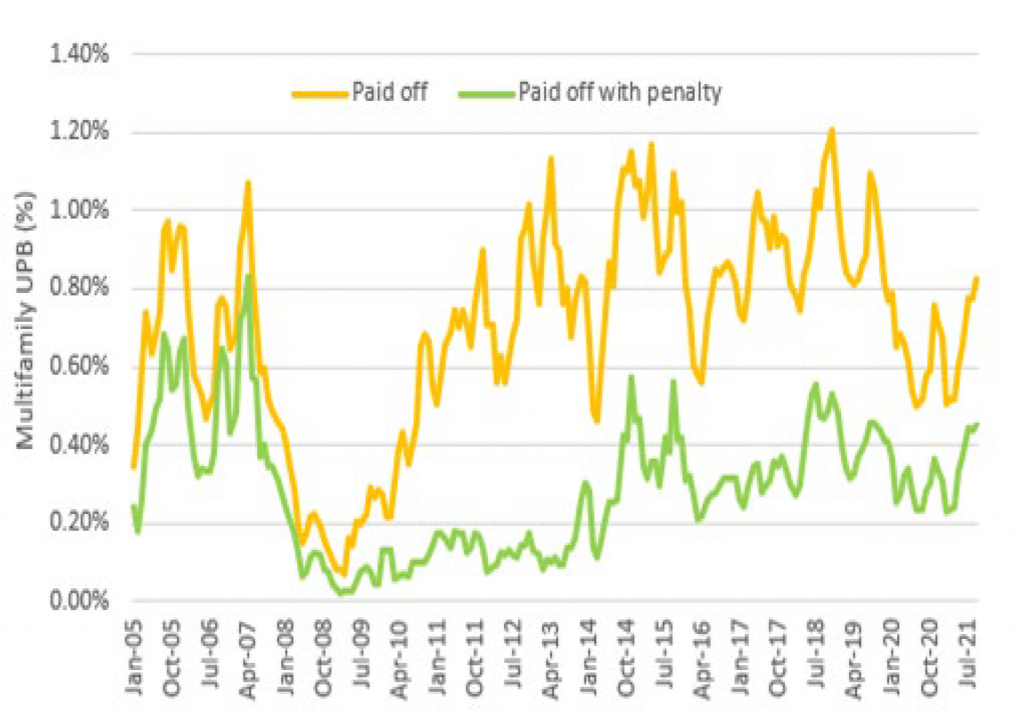
Note: Data shows the percentage of Fannie Mae multifamily UPB paid off each month, using a 3-month rolling average. Data through Q3 2021.
Source: Fannie Mae, Amherst Pierpont Securities
Multifamily property price appreciation will likely slow in 2022, but the underbuilding of housing—particularly workforce housing, which the GSEs have a mandate to support—should take years to resolve. The longer-term outlook for the sector remains robust, and investors can benefit from what should be low involuntary prepayments due to delinquencies.
This material is intended only for institutional investors and does not carry all of the independence and disclosure standards of retail debt research reports. In the preparation of this material, the author may have consulted or otherwise discussed the matters referenced herein with one or more of SCM’s trading desks, any of which may have accumulated or otherwise taken a position, long or short, in any of the financial instruments discussed in or related to this material. Further, SCM may act as a market maker or principal dealer and may have proprietary interests that differ or conflict with the recipient hereof, in connection with any financial instrument discussed in or related to this material.
This message, including any attachments or links contained herein, is subject to important disclaimers, conditions, and disclosures regarding Electronic Communications, which you can find at https://portfolio-strategy.apsec.com/sancap-disclaimers-and-disclosures.
Important Disclaimers
Copyright © 2026 Santander US Capital Markets LLC and its affiliates (“SCM”). All rights reserved. SCM is a member of FINRA and SIPC. This material is intended for limited distribution to institutions only and is not publicly available. Any unauthorized use or disclosure is prohibited.
In making this material available, SCM (i) is not providing any advice to the recipient, including, without limitation, any advice as to investment, legal, accounting, tax and financial matters, (ii) is not acting as an advisor or fiduciary in respect of the recipient, (iii) is not making any predictions or projections and (iv) intends that any recipient to which SCM has provided this material is an “institutional investor” (as defined under applicable law and regulation, including FINRA Rule 4512 and that this material will not be disseminated, in whole or part, to any third party by the recipient.
The author of this material is an economist, desk strategist or trader. In the preparation of this material, the author may have consulted or otherwise discussed the matters referenced herein with one or more of SCM’s trading desks, any of which may have accumulated or otherwise taken a position, long or short, in any of the financial instruments discussed in or related to this material. Further, SCM or any of its affiliates may act as a market maker or principal dealer and may have proprietary interests that differ or conflict with the recipient hereof, in connection with any financial instrument discussed in or related to this material.
This material (i) has been prepared for information purposes only and does not constitute a solicitation or an offer to buy or sell any securities, related investments or other financial instruments, (ii) is neither research, a “research report” as commonly understood under the securities laws and regulations promulgated thereunder nor the product of a research department, (iii) or parts thereof may have been obtained from various sources, the reliability of which has not been verified and cannot be guaranteed by SCM, (iv) should not be reproduced or disclosed to any other person, without SCM’s prior consent and (v) is not intended for distribution in any jurisdiction in which its distribution would be prohibited.
In connection with this material, SCM (i) makes no representation or warranties as to the appropriateness or reliance for use in any transaction or as to the permissibility or legality of any financial instrument in any jurisdiction, (ii) believes the information in this material to be reliable, has not independently verified such information and makes no representation, express or implied, with regard to the accuracy or completeness of such information, (iii) accepts no responsibility or liability as to any reliance placed, or investment decision made, on the basis of such information by the recipient and (iv) does not undertake, and disclaims any duty to undertake, to update or to revise the information contained in this material.
Unless otherwise stated, the views, opinions, forecasts, valuations, or estimates contained in this material are those solely of the author, as of the date of publication of this material, and are subject to change without notice. The recipient of this material should make an independent evaluation of this information and make such other investigations as the recipient considers necessary (including obtaining independent financial advice), before transacting in any financial market or instrument discussed in or related to this material.
Important disclaimers for clients in the EU and UK
This publication has been prepared by Trading Desk Strategists within the Sales and Trading functions of Santander US Capital Markets LLC (“SanCap”), the US registered broker-dealer of Santander Corporate & Investment Banking. This communication is distributed in the EEA by Banco Santander S.A., a credit institution registered in Spain and authorised and regulated by the Bank of Spain and the CNMV. Any EEA recipient of this communication that would like to affect any transaction in any security or issuer discussed herein should do so with Banco Santander S.A. or any of its affiliates (together “Santander”). This communication has been distributed in the UK by Banco Santander, S.A.’s London branch, authorised by the Bank of Spain and subject to regulatory oversight on certain matters by the Financial Conduct Authority (FCA) and the Prudential Regulation Authority (PRA).
The publication is intended for exclusive use for Professional Clients and Eligible Counterparties as defined by MiFID II and is not intended for use by retail customers or for any persons or entities in any jurisdictions or country where such distribution or use would be contrary to local law or regulation.
This material is not a product of Santander´s Research Team and does not constitute independent investment research. This is a marketing communication and may contain ¨investment recommendations¨ as defined by the Market Abuse Regulation 596/2014 ("MAR"). This publication has not been prepared in accordance with legal requirements designed to promote the independence of research and is not subject to any prohibition on dealing ahead of the dissemination of investment research. The author, date and time of the production of this publication are as indicated herein.
This publication does not constitute investment advice and may not be relied upon to form an investment decision, nor should it be construed as any offer to sell or issue or invitation to purchase, acquire or subscribe for any instruments referred herein. The publication has been prepared in good faith and based on information Santander considers reliable as of the date of publication, but Santander does not guarantee or represent, express or implied, that such information is accurate or complete. All estimates, forecasts and opinions are current as at the date of this publication and are subject to change without notice. Unless otherwise indicated, Santander does not intend to update this publication. The views and commentary in this publication may not be objective or independent of the interests of the Trading and Sales functions of Santander, who may be active participants in the markets, investments or strategies referred to herein and/or may receive compensation from investment banking and non-investment banking services from entities mentioned herein. Santander may trade as principal, make a market or hold positions in instruments (or related derivatives) and/or hold financial interest in entities discussed herein. Santander may provide market commentary or trading strategies to other clients or engage in transactions which may differ from views expressed herein. Santander may have acted upon the contents of this publication prior to you having received it.
This publication is intended for the exclusive use of the recipient and must not be reproduced, redistributed or transmitted, in whole or in part, without Santander’s consent. The recipient agrees to keep confidential at all times information contained herein.


