


The Big Idea
Sizing up the Fed’s balance sheet
Stephen Stanley | January 7, 2022
This material is a Marketing Communication and does not constitute Independent Investment Research.
The December FOMC minutes showed the Fed starting to think about reducing its balance sheet much sooner than previously anticipated. And with that, discussion and debate on renormalizing the balance sheet is already underway. But it is helpful to lay out some of the key parameters regarding the size and composition of the Fed’s holdings and how they have changed during the pandemic.
Pre-Covid balance sheet: a brief history
Until recently, Fed officials had suggested the evolution of the balance sheet in the coming rate hike cycle would look very similar to the experience of the prior cycle. The December FOMC minutes made clear that policymakers are no longer wedded to that approach, as changes in the economy are forcing a faster normalization of monetary policy than in the 2010s. Still, a brief recap of that period may be helpful as an introduction to what comes next.
The Fed engaged in several rounds of QE in 2009 (QE1), 2010-2011 (QE2), 2011-2012 (Operation Twist), and 2013-2014 (QE3). After an initial rate hike in December 2015, the Fed made no changes for most of 2016 in the wake of global economic risks before finally raising rates again in December 2016. During that period, the balance sheet was held steady as runoff of Treasuries and MBS were reinvested. Finally, in late 2017, once the Fed had gotten the funds rate to what officials considered a safe distance from the zero bound, the balance sheet was allowed to passively run off at a slow pace initially and then ramping up to a faster clip.
That process continued into 2019. By the summer of 2019, however, the repo market began to come under pressure, and the FOMC concluded that it had allowed the balance sheet to shrink too much. At that point, the Fed began to allow MBS runoff to be reinvested into Treasuries—policymakers have consistently expressed a desire to eventually get back to holding only Treasuries—while offering large amounts of RPs to get the money market universe back into balance. Those modest Treasury purchases to offset MBS runoff were ongoing in early 2020 when the pandemic hit.
A breakdown of the Fed’s balance sheet at the end of 2019 is laid out in Exhibit 1. The Fed’s balance sheet was roughly $4 trillion, consisting mostly of securities holdings. Of the $3.75 trillion in securities, about 62% was in Treasuries, with the rest in agency MBS.
Exhibit 1: Fed Balance Sheet as of 12/25/2019
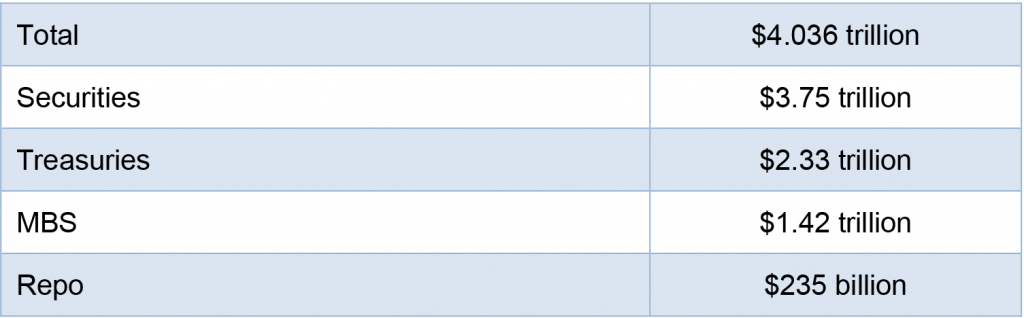
Source: Federal Reserve.
Covid Buying
The Fed engaged in unprecedented interventions during the pandemic in 2020 to attempt to prop up the financial markets and the economy. In the end, most of the novel programs, such as buying of corporate bonds, commercial paper, munis, asset-backed securities (TALF), and the Main Street lending facility, proved to be small and were mostly unwound quickly. Only the PPP liquidity facility grew to a significant size, and even that program, at close to $100 billion at its peak, was trivial compared to the overall size of the Fed’s balance sheet.
Instead, the bulk of the growth in the Fed’s liquidity provision came from its heavy buying of securities. Recall that at the height of financial market dislocations in March 2020, the Fed bought $75 billion of Treasuries per day. Even when the pace of buying was reined back in late 2020 to a more sustainable level, the buying, at $120 billion per month ($80 billion in Treasuries and $40 billion net agency MBS buys), easily exceeded the pace of QE3 (which was $45 billion per month of Treasuries and $40 billion per month of agency MBS).
A partial breakdown of the Fed’s balance sheet as of the end of 2021 is included in Exhibit 2.
Exhibit 2: Fed Balance Sheet at the End of 2021
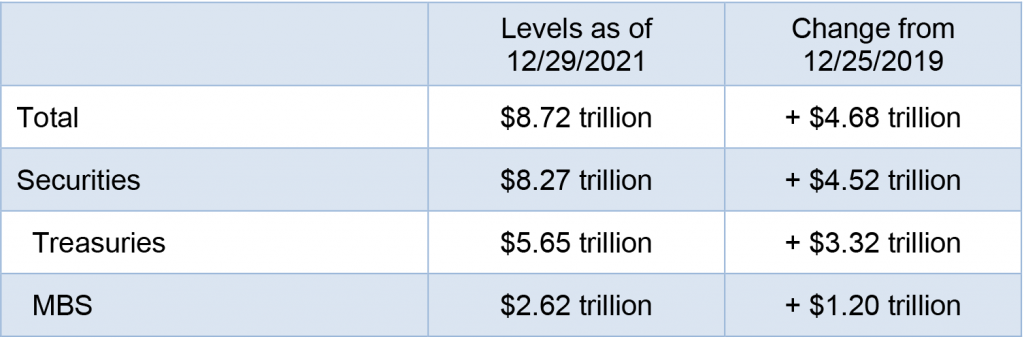
Source: Federal Reserve.
If the Fed had gotten the size of its balance sheet to roughly the “right” size by the end of 2019, then it likely has a mammoth task on its hands to extract the excess liquidity injected over the past two years. By the time, the current tapering process is completed in March, the Fed’s balance sheet will be close to $9 trillion.
Gauging the proper size of the balance sheet is more art than science, as the experience of 2019, when the Fed likely overshot in its efforts to contract, illustrates. Nevertheless, if we assume a 5% annual growth rate in liquidity that might be necessary to support the growth of the economy over time, using the size of the Fed’s credit provision at the end of 2019 as a launching point, the proper size might be in the neighborhood of $5 trillion by the end of 2023. Even if we are conservative and set a goal of $6 trillion by the end of 2024, that leaves the Fed with a need to reduce its holdings by around $3 trillion over the next few years. Certainly, at a minimum, it seems obvious that the Fed needs to sop up at least the roughly $1½ trillion that is sloshing around in the overnight reverse RP facility every day.
Getting From here to there
The Fed does have a few things in its favor. First, the larger balance sheet means that the Fed owns more securities, which, all else equal, means that a higher volume of securities will naturally run off. Second, as was mentioned in the December FOMC minutes, the structure of the Fed’s Treasuries holdings is much shorter in average maturity than in the 2010s. Back then, the Fed sold all of its short coupon holdings in its Operation Twist operations and bought heavily in the long end of the yield curve to try to maximize its bang for the buck. Thus, it had less securities rolling off when it finally decided to reduce the balance sheet.
The Fed owns in the neighborhood of $750 billion in Treasuries maturing in 2022 and slightly more in 2023. However, the month-to-month totals for maturing Treasuries is quite lumpy. If the Fed uses monthly caps to smooth out the pace at which Treasury runoff occurs, as it did in 2017 and 2018, then it may not be able to run off much more than $500 billion per year in Treasuries.
Unfortunately, in a rising-rate environment, the Fed can expect runoff in its agency MBS portfolio to slow sharply. In 2018 and 2019, the Fed was only able to achieve about 10% runoff in its MBS holdings per year. Given the current size of the MBS portfolio, that implies that it would take about two years to achieve around $500 billion of runoff. In my view, this might be an upside bound of runoff since I would expect rates to be rising faster over the next few years than they did in 2018 and 2019, but there are many variables that go into prepayment behavior.
Tallying it all up, if the Fed were to start allowing runoff at a rapid pace as soon as mid-2022, which seems to be the most aggressive likely approach of a range of possibilities, then it might be able to achieve something like $1.8 trillion in runoff in securities (about $1.2 trillion in Treasuries and $600 billion in MBS) over the 2.5-year period to the end of 2024.
That would still leave the balance sheet larger than its likely proper size by as much as $2 trillion nearly three years after liftoff. This is why I would not want to rule out the possibility of outright selling at some point over the next several years. The FOMC would clearly prefer to avoid that, but if inflation remains well above the Fed’s target range and the Fed is struggling to get monetary policy normalized quickly enough, then balance sheet reduction steps could diverge from the pattern of the prior cycle, just as the tapering process had to be accelerated in recent months and rate hikes might need to be substantially quicker than in 2015-2018.
In any case, this arithmetic presents a compelling case for getting started sooner rather than later. Governor Waller suggested after the December FOMC meeting that balance sheet reduction should start as early as this summer, which, at the time, seemed like an especially hawkish position. However, the December FOMC minutes pointed to wider support for a quick turnaround on the balance sheet. Given how long it will take to pare down securities holdings, there would appear to be no convincing argument for waiting very long to commence.