


The Big Idea
Credit closes a strong year and looks ahead
Steven Abrahams | January 7, 2022
This material is a Marketing Communication and does not constitute Independent Investment Research.
Deep credit finished the last quarter of 2021 pretty much the same way it finished every quarter of the year—printing the most efficient returns among major sectors of fixed income. High yield and leveraged loans posted higher absolute and excess returns than other assets, and the volatility of those returns generally finished lower. Safer assets, with risk premiums squeezed by Fed QE, trailed well behind. It’s déjà vu. But there is one big risk to repeating these results through 2022: accelerated tightening by the Fed.
Results from the quarterly race for returns
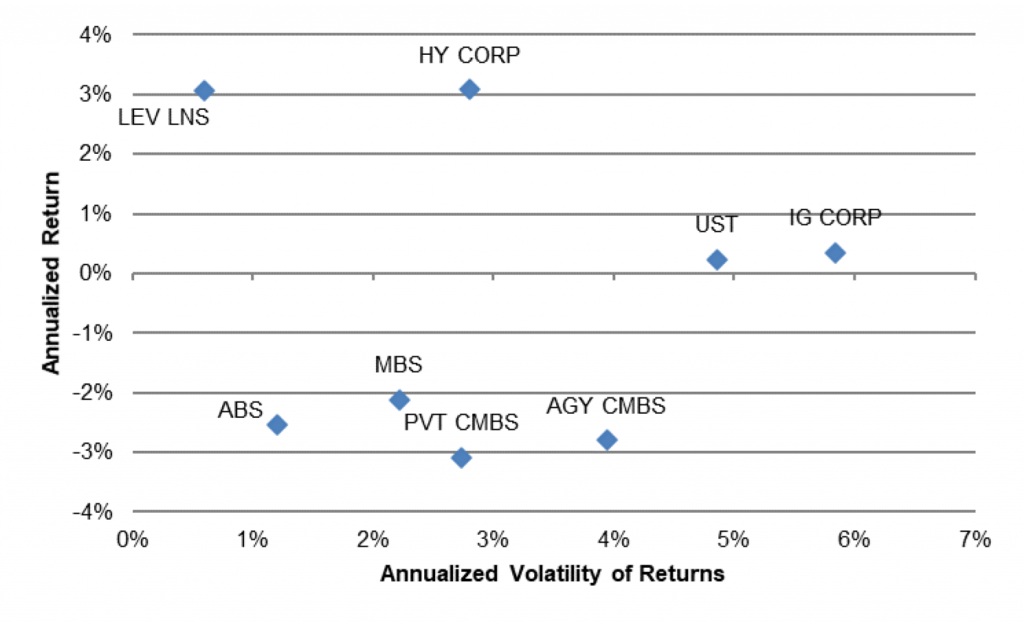
High yield corporate debt in the last quarter delivered a 3.08% annualized return with 2.80% annualized volatility, and leveraged loans delivered a 3.07% return with its typically low 0.60% volatility (Exhibit 1). That put deep credit well ahead of the next tier of performers, which took bigger hits from a flattening yield curve and from wider spreads, and barely hung on in positive territory. Investment grade corporate debt only printed a 0.35% annualized return with 5.84% volatility, and Treasury debt only printed a 0.23% return with 4.86% volatility. Other major sectors of fixed income—ABS, agency MBS and private and agency CMBS—lost an annualized 2% or more with volatility ranging from low to moderate.
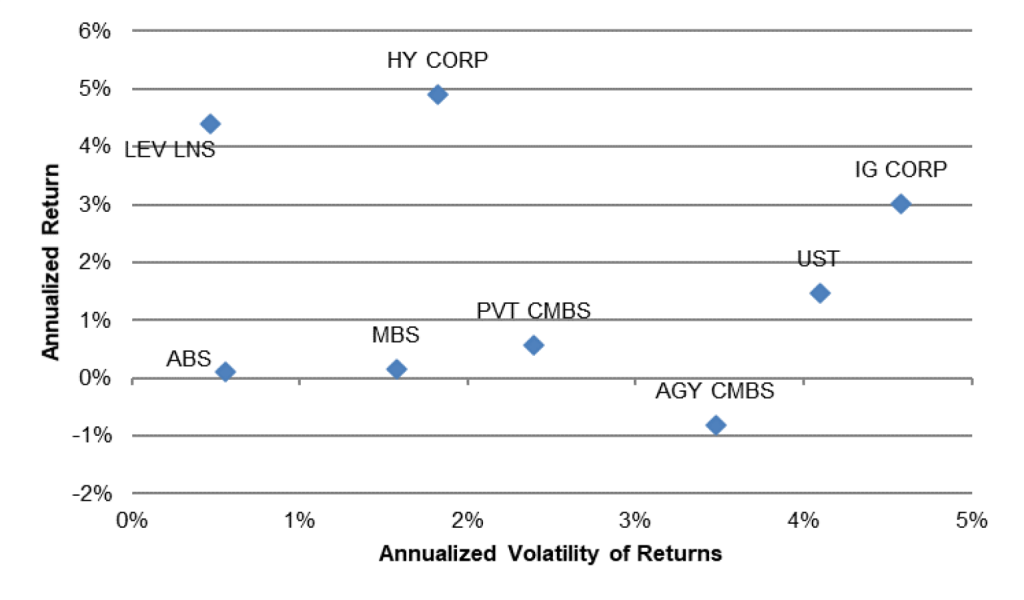
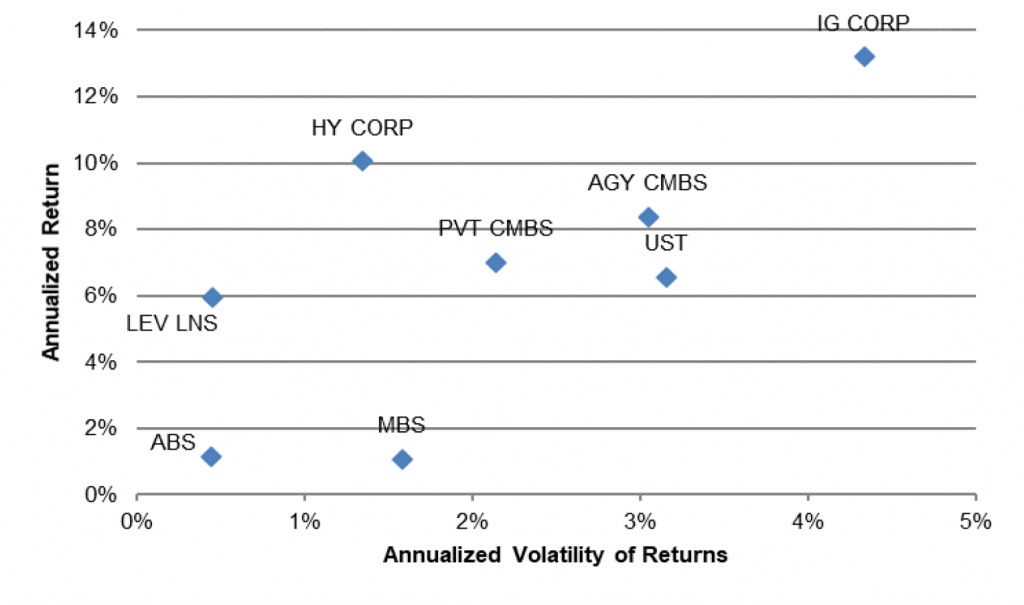
Exhibit 1: Deep credit delivered strong results across each quarter of 2021
Asset performance in 4Q2021
Asset performance in 3Q2021
Asset performance in 2Q2021
Asset performance in 1Q2021
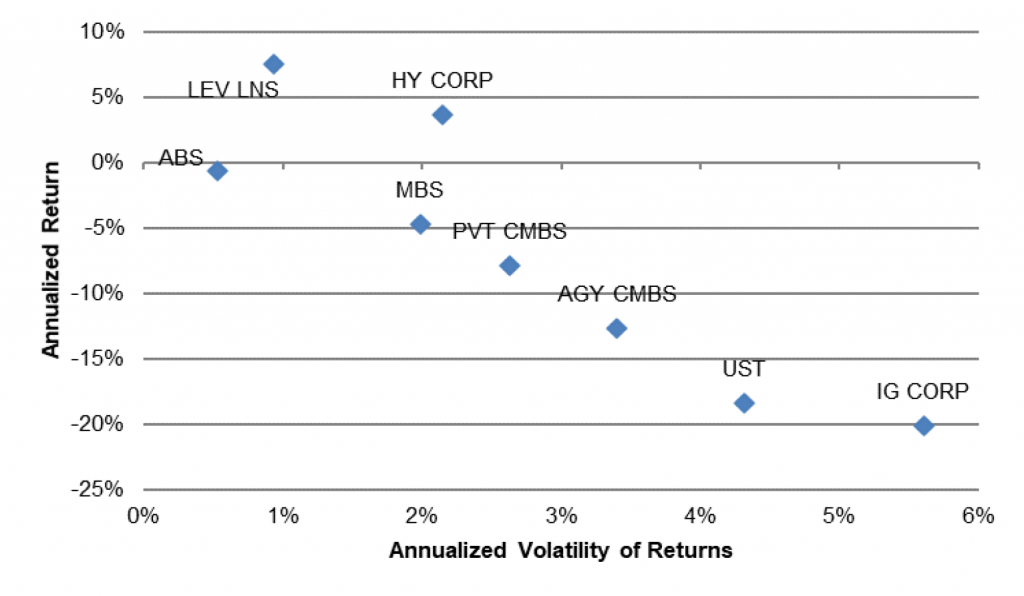
Note: annualized daily returns and daily return volatility based on Bloomberg Barclays indices for all assets except leveraged loans, which uses the S&P/LSTA Total Return Index.
Source: Bloomberg, Amherst Pierpont Securities.
Results from the closing quarter of 2021 ran in striking parallel to the third quarter, with high yield and leveraged loans well ahead on annualized performance from July through September and below most other sectors on volatility. Investment grade corporate debt and Treasury debt in the third quarter again finished as a second tier below deep credit. And ABS, agency MBS and private and agency CMBS trailed again.
In earlier quarters, deep credit also tended to lead, but sizable differences in asset total returns came from differences in duration and from big shifts in rates. Investment grade corporate debt and Treasury debt, with the longest durations by far, swung significantly as rates generally rose in the first quarter of 2021 and then fell in the second quarter. High yield debt and leverage loans came into each quarter with relatively low duration, making their returns significantly less sensitive to shifts in rates (Exhibit 2).
Exhibit 2: Difference in early 2021 returns strongly reflect differences in duration
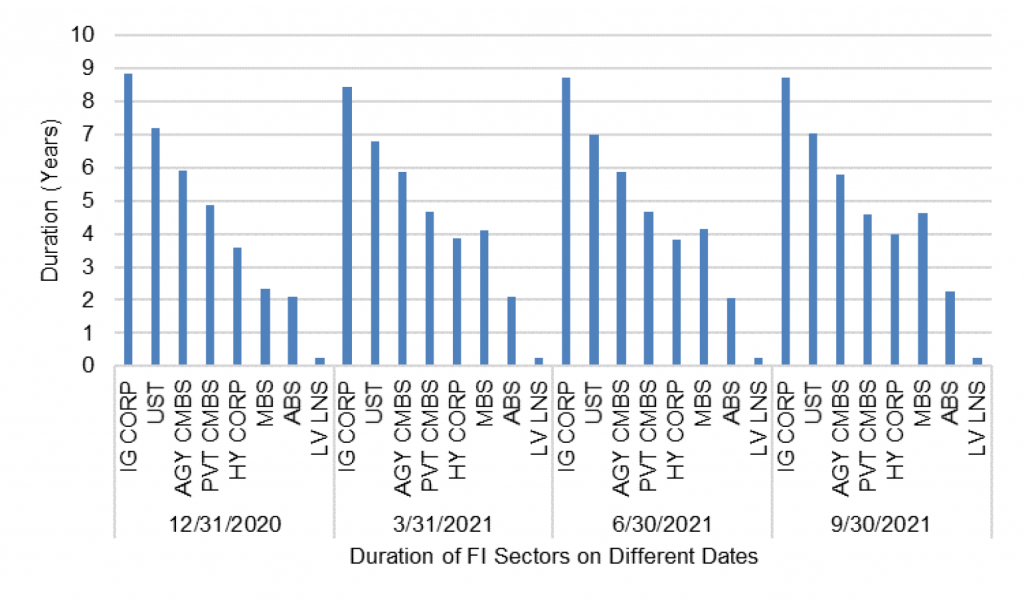
Note: Durations based on Bloomberg Barclays indices, except for an assumed duration for leveraged loans.
Source: Bloomberg, Amherst Pierpont Securities.
Stripping out the impact of rates and looking only at excess return—return largely due to carry, reinvestment and shifts in sector spreads—deep credit also finished 2021 strong. High yield turned in excess annualized returns of 4.36% with relatively high volatility while leveraged loans turned in 2.99% with low volatility (Exhibit 3). Excess returns on all other assets ranged from zero to roughly a 1% loss. The pattern of excess returns in the fourth quarter again closely paralleled the third quarter and echoed returns from earlier in the year.
Exhibit 3: Deep credit also did well in 4Q21 after stripping out the impact of rates
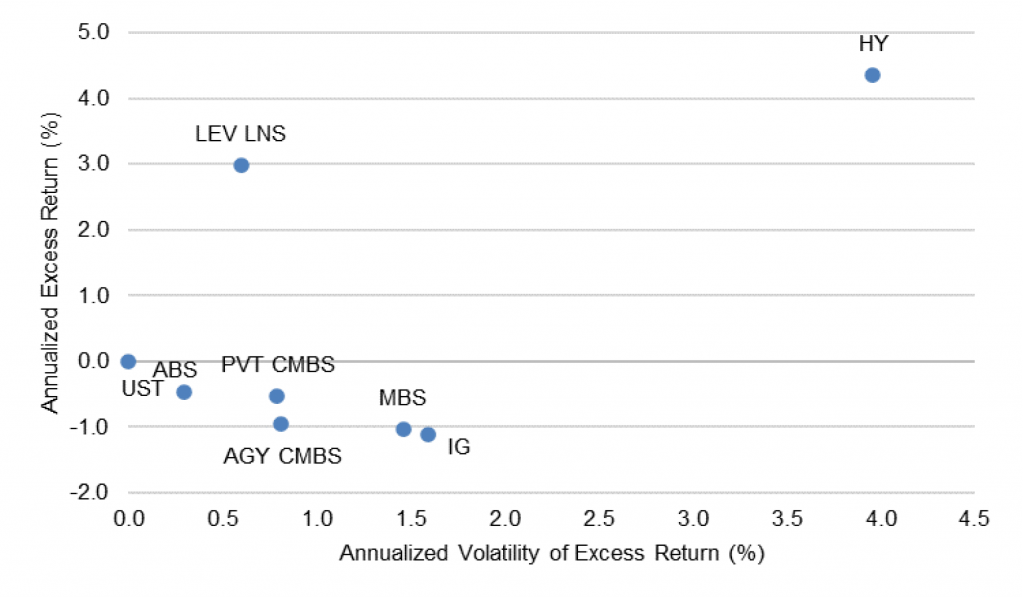
Note: Durations based on Bloomberg Barclays indices, except for an assumed duration for leveraged loans.
Source: Bloomberg, Amherst Pierpont Securities.
Another important result from last year’s closing quarter showed up in the correlation of asset returns. As they had in earlier periods, high yield debt and leveraged loans showed either low or slightly negative correlation with other major sectors of fixed income, pointing to significant portfolio diversification from these assets (Exhibit 4). Other assets including investment grade corporate debt and other sectors with relatively long duration showed high correlation with each other, suggesting a tight link in returns for safer assets. Deep credit is highly sensitive to expectations for growth. Higher growth should pull spreads on deep credit tighter while slower growth pushes them wider. Those same shifts in growth expectations generally send performance on rates products in the opposite direction—higher growth pushing rates up and returns down, and lower growth doing the opposite–contributing to the small negative correlations.
Exhibit 4: Deep credit in 4Q21 showed negative correlation to rates products
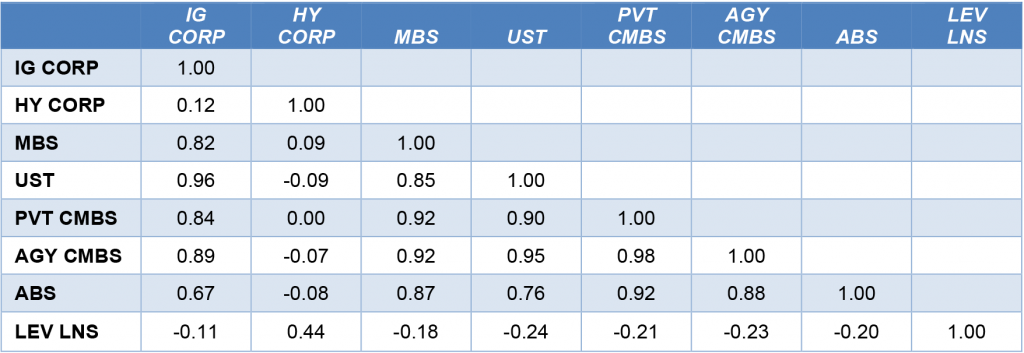
Note: Data show correlation of daily returns based on Bloomberg Barclays indices for all assets except leveraged loans, which uses the S&P/LSTA Total Return Index.
Source: Bloomberg, Amherst Pierpont Securities.
Surfing on waves of monetary and fiscal policy
Investment performance in most quarters since March 2020 has ridden a wave of supporting monetary and fiscal policies that should go down in the history books. Fed QE has squeezed risk premiums in safe assets while low rates have cut the cost of debt for corporations and consumers. Federal spending has left corporations and consumers flush with cash. And even though all of this has led to sharply higher inflation, labor markets have tightened and corporate profits have set records. Knowing this, weak returns in safe fixed income assets and stronger returns in the most levered credits are no surprise.
Even though the Fed is well into tapering and likely to hike soon after bringing taper to a close, the impact of broad system liquidity, a tight labor market and strong corporate and consumer balance sheets is likely to linger. There is an inflection point out there somewhere where policy support peaks and comes down, but we are more likely on a plateau for now.
The risk of an accelerating Fed
The big risk to a repeating pattern of strong returns in deep credit and weaker returns in the safest assets comes from a Fed that may have to tighten faster than the market now expects. And this is a clear risk. The Fed needs to find a way to get inflation from its latest mark of 6.8% year-over-year on CPI down to something more consistent with its 2.0% target. TIPS breakevens suggest the market still thinks inflation will fall—5-year forward 5-year implied inflation is priced at only 218 bp—but those inflation expectations went up through December. The recently released minutes from the FOMC highlight concern that the Fed may need to hike sooner and faster than anticipated and start allowing its QE portfolio to run off sooner. As Bill Nelson, chief economist at the Bank Policy Institute and former deputy chief of the monetary affairs division at the Fed wrote after the minutes came out, “the FOMC is no longer worried its legacy will be ‘the Committee that tightened too soon,’ but rather that it will be ‘the Committee that wasted four decades of successful inflation fighting.’”
The yield curve could flatten and possibly invert faster than the market now expects, fueling concern about slowing growth. That would be an obvious inflection point in the bullish market for deep credit. Investors can monitor a couple of different early warning systems—the speeches and other smoke signals from the Fed, spreads in the most credit-sensitive parts of the corporate and securitized markets and spreads on highly leveraged debt at new issue such as high yield, speculative-grade CLOs and highly leveraged whole business securitizations. These should be the first places to see risk appetite reverse. But if inflation continues to print high numbers through 2022 and the Fed accelerates its tightening, it will be time to start rotating from risk to riskless.
* * *
The view in rates
The Fed’s RRP facility is closing Friday with balances at $1.53 trillion, down more than $470 billion from the record high closing mark at the end of the year. Treasury repo rates have shown some softness in the last few weeks, with SOFR dipping below 5 bp at some points. With the RRP facility paying 5 bp, it is getting heavy action. The high balances continue speaking to the tremendous amounts of cash available in financial markets.
Settings on 3-month LIBOR have closed Friday at 23.129 bp. It has moved up steady from 12 bp in early October as Fed hikes keep getting moved up in the market’s calendar. With markets that used to price to LIBOR now pricing to SOFR, it is worth noting that SOFR has not moved in months off it’s 5 bp mark, so the LIBOR-to-SOFR spread keeps widening. With a more aggressive taper, deceleration of liquidity and anticipated Fed hikes, yields even at the shortest end of the curve should continue to rise.
The 10-year note has finished the most recent session at 1.77% as yields across the curve continue to reprice to a more aggressive and hawkish Fed. The December FOMC minutes added to the hawkish tone, showing almost no remaining doves and raising the possibility of running down the Fed portfolio faster than the last time around. The 10-year real rate finished the week at negative 76 bp, up 34 bp from the end of the year. This is a bullish sign for market views of growth. The market through almost all of 2021 remained priced for significant excess liquidity in the future and an economy too slow to generate the borrowing needed to fully absorb it all. There still is a significant way to go, but the market is now well off its most bearish levels.
The Treasury yield curve has finished its most recent session with 2s10s at 90 bp and 5s30s at 61 bp. The shallow path of Fed funds in the Fed’s own dots has kept shorter rates from rising as aggressively as the rest of the curve.
The view in spreads
The strands of pandemic, inflation, growth, labor and Fed policy create an unusually wide range of possible outcomes next year and beyond. Volatility should rise next year and add pressure for spreads to go wider, although tremendous market liquidity should push in the opposite direction.
Of the major spread markets, corporate and structured credit is likely to outperform. Corporates benefit from strong corporate fundamentals and from buyers not tied to Fed policy. The biggest buyers of credit include money managers, international investors and insurers while the only net buyers of MBS during pandemic have been the Fed and banks. Credit buyers continue to have investment demand. Demand from Fed and banks should soften as taper begins, Once the Fed shows it hand on the timing and pace of taper, the market should be able to fully price the softening in Fed and bank demand and spreads should stabilize. But something else is on the horizon.
MBS stands to face a fundamental challenge in the next few months as the market starts to price the impact of higher Fannie Mae and Freddie Mac loan limits. Home prices in 2021 delivered a nearly 20% year-over-year gain, which have been reflected in new agency loan limits. The jump in loans balances should add significant negative convexity to the TBA market and increase net supply. And this will come just as the Fed leans into tapering, which will take out a buyer that often absorbed the most negatively convex pools from TBA and a large share of net supply. The quality of TBA should deteriorate and the supply swell.
The view in credit
Credit fundamentals continue to look strong. Corporations have record earnings, good margins, low multiples of debt to gross profits, low debt service and good liquidity. The consumer balance sheet now shows some of the lowest debt service on record as a percentage of disposal income. That reflects both low rates and government support during pandemic. Rising home prices and rising stock prices have both added to consumer net worth, also now at a record although not equally distributed across households. Consumers are also liquid, with near record amounts of cash in the bank. Strong credit fundamentals may explain some of the relatively stable spreads.