By the Numbers
Lessons learned in CMBS in 2021
This material is a Marketing Communication and does not constitute Independent Investment Research.
One overarching lesson from 2021 is that forbearance works. The wave of commercial real estate delinquencies that rapidly built up during the early stages of the pandemic has not transitioned into a tsunami of defaults. A corollary is that forbearance was successful, in part, thanks to a backdrop of rapidly appreciating property prices across the multifamily sector. Lesson two is that there will always be unpredictable beneficiaries of a crisis, and among the beneficiaries of the pandemic were the industrial and self-storage sectors. The lingering question is whether or not the rather dramatic property price appreciation will be supported as the economy and life normalizes, or if some arguably bubbly areas may deflate.
#1 Forbearance works
The delinquency rate for US CMBS securities peaked at 9.0% in August 2020 and has been falling steadily since then, reaching 3.6% in November 2021. CMBS loans in conduit or SASB deals are marked delinquent while they are in forbearance, so that rate includes loans that are in forbearance. Although the transition rates for loans from 30-days delinquent to 90+ days delinquent was close to 100% during the latter half of 2020, there has been virtually no increase in loan balances in foreclosure, REO or nonperforming matured loans since the pandemic began (Exhibit 1).
Exhibit 1: Delinquency balance by status
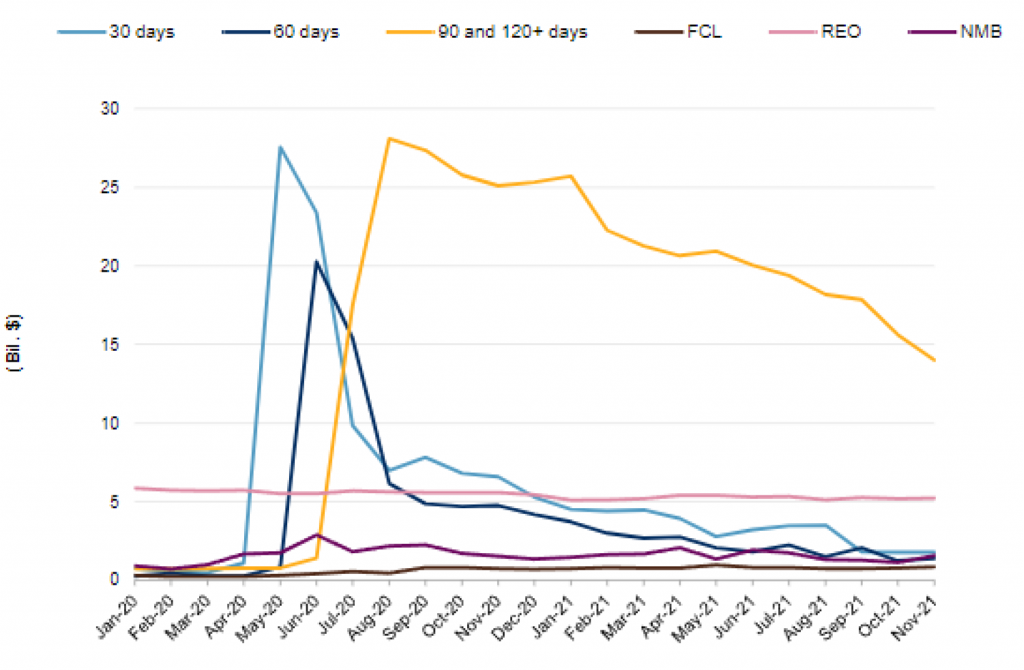
Note: FCL is foreclosure; REO is real estate owned; NMB is nonperforming matured balloon.
Source: S&P Financial Services
Seriously delinquent balances have been trending down since September 2020 because those loans that are delinquent – about two-thirds of which received some form of forbearance – have been gradually curing and have returned to reperforming status. The property type breakdown of the loans that are still in forbearance as of November 2021 is: 60% lodging properties, 28% retail, 5.2% office, 1.3% multifamily and 4.7% other. Although some CMBS loans will likely transition from delinquency or forbearance to foreclosure or REO, so far the impact of forbearance appears to have dramatically buffered the impact of the pandemic on commercial real estate performance, and allowed borrowers the time to recover as the economy rebuilt momentum.
Exhibit 2: Green Street commercial property price index (CPPI)
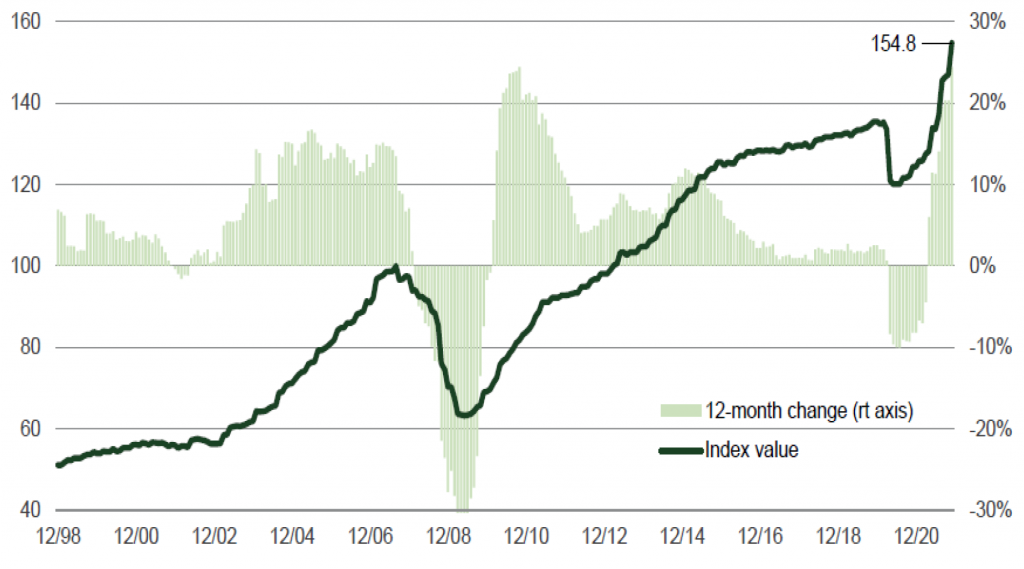
Note: All property CPPI is retail (20%), office (17.5%), apartment (15%), healthcare (15%), industrial (10%), lodging (7.5%), net lease (5%), self-storage (5%), manufactured home park (2.5%), student housing (2.5%). Retail is mall (50%) and strip retail (50%).
Source: Green Street Advisors
#2 Crisis has its beneficiaries
During the initial stages of the pandemic, when overall commercial real estate prices dropped suddenly by 10% (Exhibit 2), many analysts were projecting that prices would fall by 15% to 30%, similar to the drop seen during the housing crisis. That didn’t happen. Thanks partially to forbearance and partially to a surge of people buying homes and renting homes outside of urban cores, both multifamily and single-family property prices began to appreciate rapidly. The pandemic-driven desire for less dense housing hit a two-decade long housing shortage head-on, driving single-family house prices and multi-family rents up roughly 20% year-over-year in 2021. The best performing CRE sectors since pre-Covid are also entirely pandemic-driven: self-storage (66%), industrial (53%), manufactured homes (34%) and apartments (22%).
Exhibit 3: Green Street sector-level property price indices
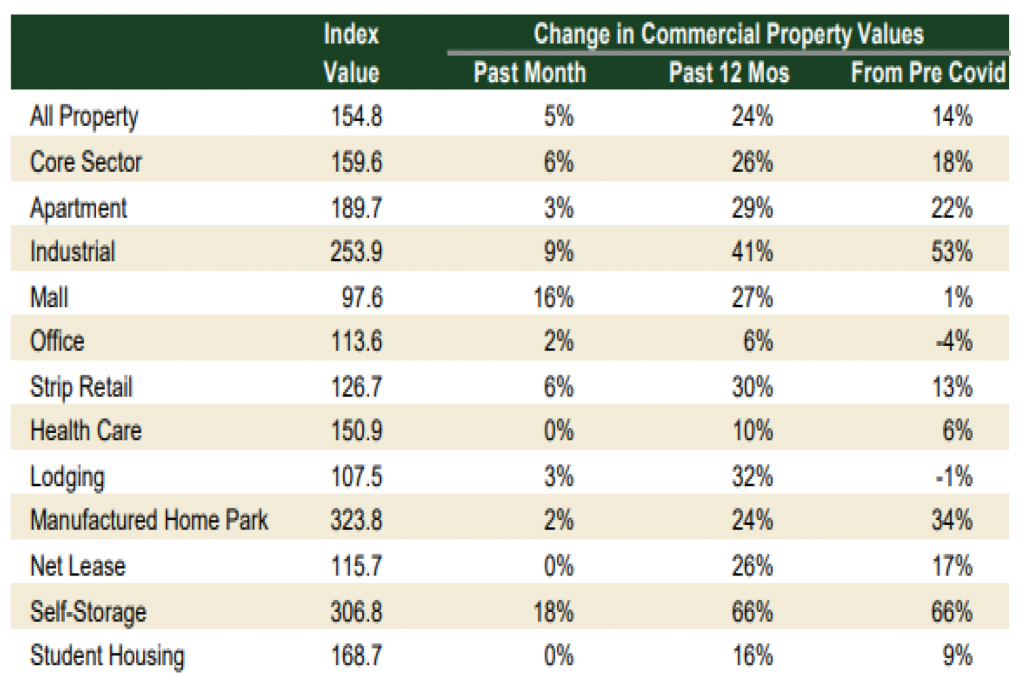
Note: Data as of November 2021.
Source: Green Street Advisors
#3 A correction or stabilization depends on the sector
There is some evidence that both single-family and multifamily property prices are beginning to plateau. Fundamentally the long-term outlook for both remains quite strong given two decades of under building. Moderation in home price appreciation would be reasonable and expected in 2022. Further appreciation could be evidence of frothy markets, with a potentially higher likelihood of a modest correction. Industrial properties – which have rapidly appreciated due in part to a business shift towards home delivery and a last mile accommodation – are likely to be sticky at new, higher levels as the need for additional warehouse capacity should be permanent.
What the pandemic may have also forever changed is preference for remote or hybrid work, and how that impacts the need for office space – especially in dense, urban cores. Office property price remain down 4% compared to pre-Covid levels. Only lodging prices are still broadly in the red, down 1%, but travel is expected to bounce back. Office work is possibly permanently on a track to be done more from suburban offices, co-working spaces and homes, decreasing the need for a large urban footprint. If there is any lesson from 2021, it’s that the new normal is not going to look exactly like the old normal.
This material is intended only for institutional investors and does not carry all of the independence and disclosure standards of retail debt research reports. In the preparation of this material, the author may have consulted or otherwise discussed the matters referenced herein with one or more of SCM’s trading desks, any of which may have accumulated or otherwise taken a position, long or short, in any of the financial instruments discussed in or related to this material. Further, SCM may act as a market maker or principal dealer and may have proprietary interests that differ or conflict with the recipient hereof, in connection with any financial instrument discussed in or related to this material.
This message, including any attachments or links contained herein, is subject to important disclaimers, conditions, and disclosures regarding Electronic Communications, which you can find at https://portfolio-strategy.apsec.com/sancap-disclaimers-and-disclosures.
Important Disclaimers
Copyright © 2026 Santander US Capital Markets LLC and its affiliates (“SCM”). All rights reserved. SCM is a member of FINRA and SIPC. This material is intended for limited distribution to institutions only and is not publicly available. Any unauthorized use or disclosure is prohibited.
In making this material available, SCM (i) is not providing any advice to the recipient, including, without limitation, any advice as to investment, legal, accounting, tax and financial matters, (ii) is not acting as an advisor or fiduciary in respect of the recipient, (iii) is not making any predictions or projections and (iv) intends that any recipient to which SCM has provided this material is an “institutional investor” (as defined under applicable law and regulation, including FINRA Rule 4512 and that this material will not be disseminated, in whole or part, to any third party by the recipient.
The author of this material is an economist, desk strategist or trader. In the preparation of this material, the author may have consulted or otherwise discussed the matters referenced herein with one or more of SCM’s trading desks, any of which may have accumulated or otherwise taken a position, long or short, in any of the financial instruments discussed in or related to this material. Further, SCM or any of its affiliates may act as a market maker or principal dealer and may have proprietary interests that differ or conflict with the recipient hereof, in connection with any financial instrument discussed in or related to this material.
This material (i) has been prepared for information purposes only and does not constitute a solicitation or an offer to buy or sell any securities, related investments or other financial instruments, (ii) is neither research, a “research report” as commonly understood under the securities laws and regulations promulgated thereunder nor the product of a research department, (iii) or parts thereof may have been obtained from various sources, the reliability of which has not been verified and cannot be guaranteed by SCM, (iv) should not be reproduced or disclosed to any other person, without SCM’s prior consent and (v) is not intended for distribution in any jurisdiction in which its distribution would be prohibited.
In connection with this material, SCM (i) makes no representation or warranties as to the appropriateness or reliance for use in any transaction or as to the permissibility or legality of any financial instrument in any jurisdiction, (ii) believes the information in this material to be reliable, has not independently verified such information and makes no representation, express or implied, with regard to the accuracy or completeness of such information, (iii) accepts no responsibility or liability as to any reliance placed, or investment decision made, on the basis of such information by the recipient and (iv) does not undertake, and disclaims any duty to undertake, to update or to revise the information contained in this material.
Unless otherwise stated, the views, opinions, forecasts, valuations, or estimates contained in this material are those solely of the author, as of the date of publication of this material, and are subject to change without notice. The recipient of this material should make an independent evaluation of this information and make such other investigations as the recipient considers necessary (including obtaining independent financial advice), before transacting in any financial market or instrument discussed in or related to this material.
Important disclaimers for clients in the EU and UK
This publication has been prepared by Trading Desk Strategists within the Sales and Trading functions of Santander US Capital Markets LLC (“SanCap”), the US registered broker-dealer of Santander Corporate & Investment Banking. This communication is distributed in the EEA by Banco Santander S.A., a credit institution registered in Spain and authorised and regulated by the Bank of Spain and the CNMV. Any EEA recipient of this communication that would like to affect any transaction in any security or issuer discussed herein should do so with Banco Santander S.A. or any of its affiliates (together “Santander”). This communication has been distributed in the UK by Banco Santander, S.A.’s London branch, authorised by the Bank of Spain and subject to regulatory oversight on certain matters by the Financial Conduct Authority (FCA) and the Prudential Regulation Authority (PRA).
The publication is intended for exclusive use for Professional Clients and Eligible Counterparties as defined by MiFID II and is not intended for use by retail customers or for any persons or entities in any jurisdictions or country where such distribution or use would be contrary to local law or regulation.
This material is not a product of Santander´s Research Team and does not constitute independent investment research. This is a marketing communication and may contain ¨investment recommendations¨ as defined by the Market Abuse Regulation 596/2014 ("MAR"). This publication has not been prepared in accordance with legal requirements designed to promote the independence of research and is not subject to any prohibition on dealing ahead of the dissemination of investment research. The author, date and time of the production of this publication are as indicated herein.
This publication does not constitute investment advice and may not be relied upon to form an investment decision, nor should it be construed as any offer to sell or issue or invitation to purchase, acquire or subscribe for any instruments referred herein. The publication has been prepared in good faith and based on information Santander considers reliable as of the date of publication, but Santander does not guarantee or represent, express or implied, that such information is accurate or complete. All estimates, forecasts and opinions are current as at the date of this publication and are subject to change without notice. Unless otherwise indicated, Santander does not intend to update this publication. The views and commentary in this publication may not be objective or independent of the interests of the Trading and Sales functions of Santander, who may be active participants in the markets, investments or strategies referred to herein and/or may receive compensation from investment banking and non-investment banking services from entities mentioned herein. Santander may trade as principal, make a market or hold positions in instruments (or related derivatives) and/or hold financial interest in entities discussed herein. Santander may provide market commentary or trading strategies to other clients or engage in transactions which may differ from views expressed herein. Santander may have acted upon the contents of this publication prior to you having received it.
This publication is intended for the exclusive use of the recipient and must not be reproduced, redistributed or transmitted, in whole or in part, without Santander’s consent. The recipient agrees to keep confidential at all times information contained herein.


